
AI-assisted content notice: This documentation was created with support from artificial intelligence and has been reviewed by humans for accuracy.
WebSocket Event Stream
openITCOCKPIT provides a WebSocket Event Stream, which allows real-time access to events and notifications from the monitoring system.
Info
Requires openITCOCKPIT ≥ 5.8.0
Usage and Configuration
The WebSocket endpoint is available at ws://<host>:<port>/ws and provided by the Statusengine Worker. By
default, the worker listens on 127.0.0.1:8091, so the local endpoint is
ws://127.0.0.1:8091/ws. Use wss:// when TLS is terminated by a reverse
proxy.
Authentication is always required. Supply an API key using one of the following methods:
| Method | Example | Intended use |
|---|---|---|
Authorization header |
Authorization: Bearer <api-key> |
Recommended for clients that can set HTTP headers. |
X-Api-Key header |
X-Api-Key: <api-key> |
Alternative for clients that can set HTTP headers. |
api_key query parameter |
ws://host:8091/ws?api_key=<api-key> |
Browser clients only, because the browser WebSocket API cannot set custom headers. |
An invalid or missing API key causes the worker to reject the connection with
HTTP 401 before the WebSocket handshake is completed.
Topics can be selected when connecting with the optional, comma-separated
topics query parameter:
ws://127.0.0.1:8091/ws?api_key=<api-key>&topics=statusngin_hoststatus,statusngin_servicestatus
When no topics are specified, the client receives events for all topics.
Create API key and change listening address
By default, the WebSocket server listens on 127.0.0.1:8091 and is only accessible locally. It is recommended to use a reverse proxy to expose it securely if remote access is needed. Statusengine itself will generate a random API Key on startup, so the /ws endpoint is never unprotected.
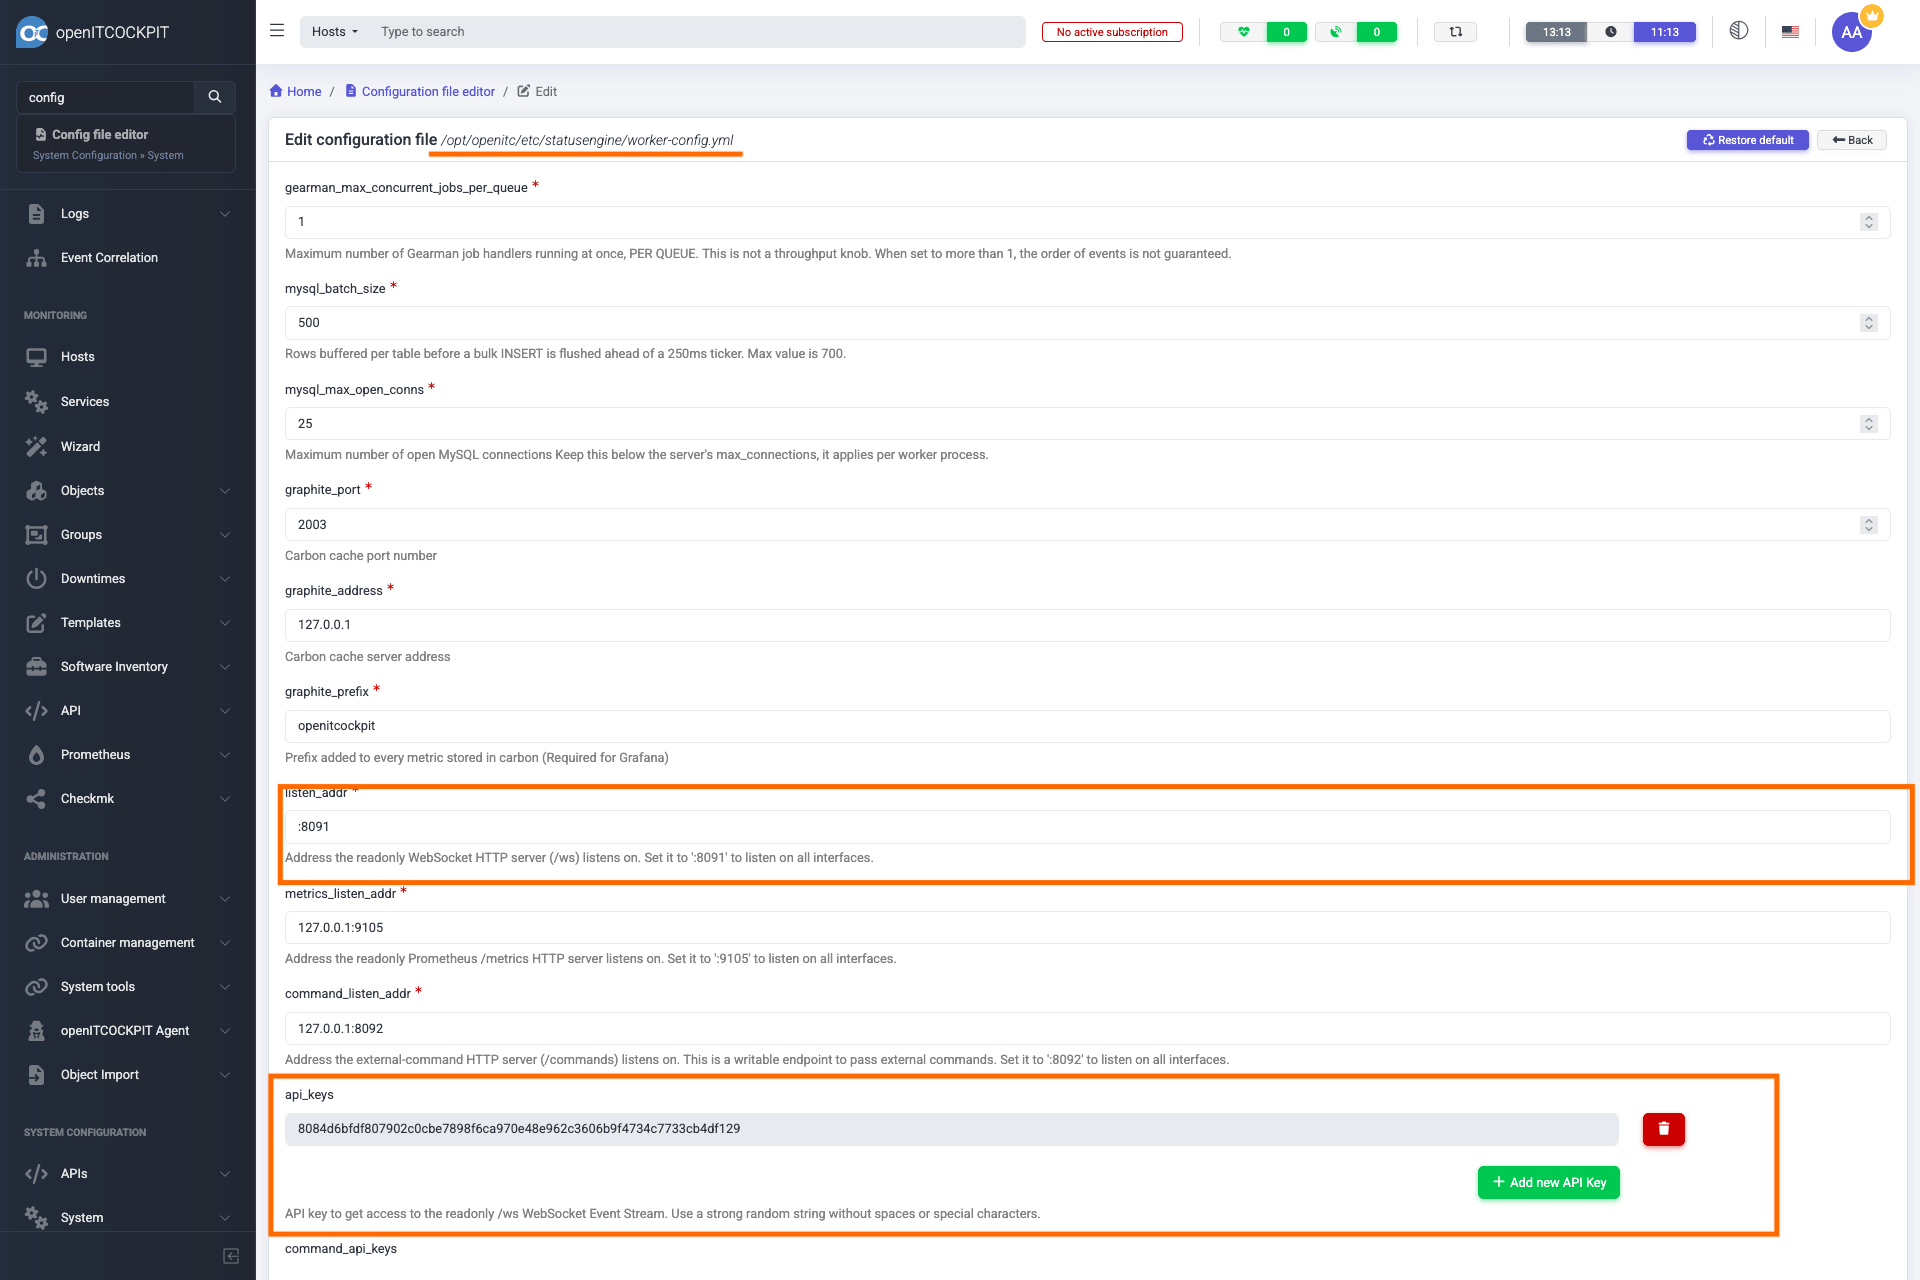
To get a static API key, go to the openITCOCKPIT web interface, navigate to System → Config file editor and edit the file /opt/openitc/etc/statusengine/worker-config.yml.
Scroll down to api_keys and click on "Add new API key". openITCOCKPIT will automatically generate a strong and secure API key. You can define up to 25 API keys.
To change the listening address, edit the field listen_addr. Set :8091 to make the server listen on all network interfaces on port 8091. (not recommended)
WebSocket Frames
A server-to-client message is one WebSocket frame per queue job. It contains the
queue name in topic and the events from that job in payload:
{
    "topic": "statusngin_hoststatus",
    "payload": [
        {"name": "localhost"},
        {"name": "db01"}
    ]
}
payload is always an array of events.
Delivery and reconnects
The Event Stream is not a persistent message queue. Events sent while a client is disconnected, as well as frames dropped because of a full buffer, are not replayed. Clients must detect closed connections, reconnect themselves, and restore their required topic subscriptions after reconnecting.
Slow Consumers
Every client has a dedicated 256-frame buffer. If the client cannot keep up with the incoming messages and the buffer overflows, the server will drop new events for this client until the client catches up. This mechanism prevents slow consumers from affecting the delivery of events to other clients.
The Prometheus metric statusengine_websocket_messages_dropped_total will be incremented.
Subscription Control
At runtime, clients can change their subscription by sending JSON control
frames. subscribe adds topics and unsubscribe removes topics from the
current subscription. Both properties are optional and can be combined in one
frame.
{"subscribe": ["statusngin_hoststatus", "statusngin_servicestatus"]}
{"unsubscribe": ["statusngin_servicestatus"]}
{
    "subscribe": ["statusngin_notifications"],
    "unsubscribe": ["statusngin_hoststatus"]
}
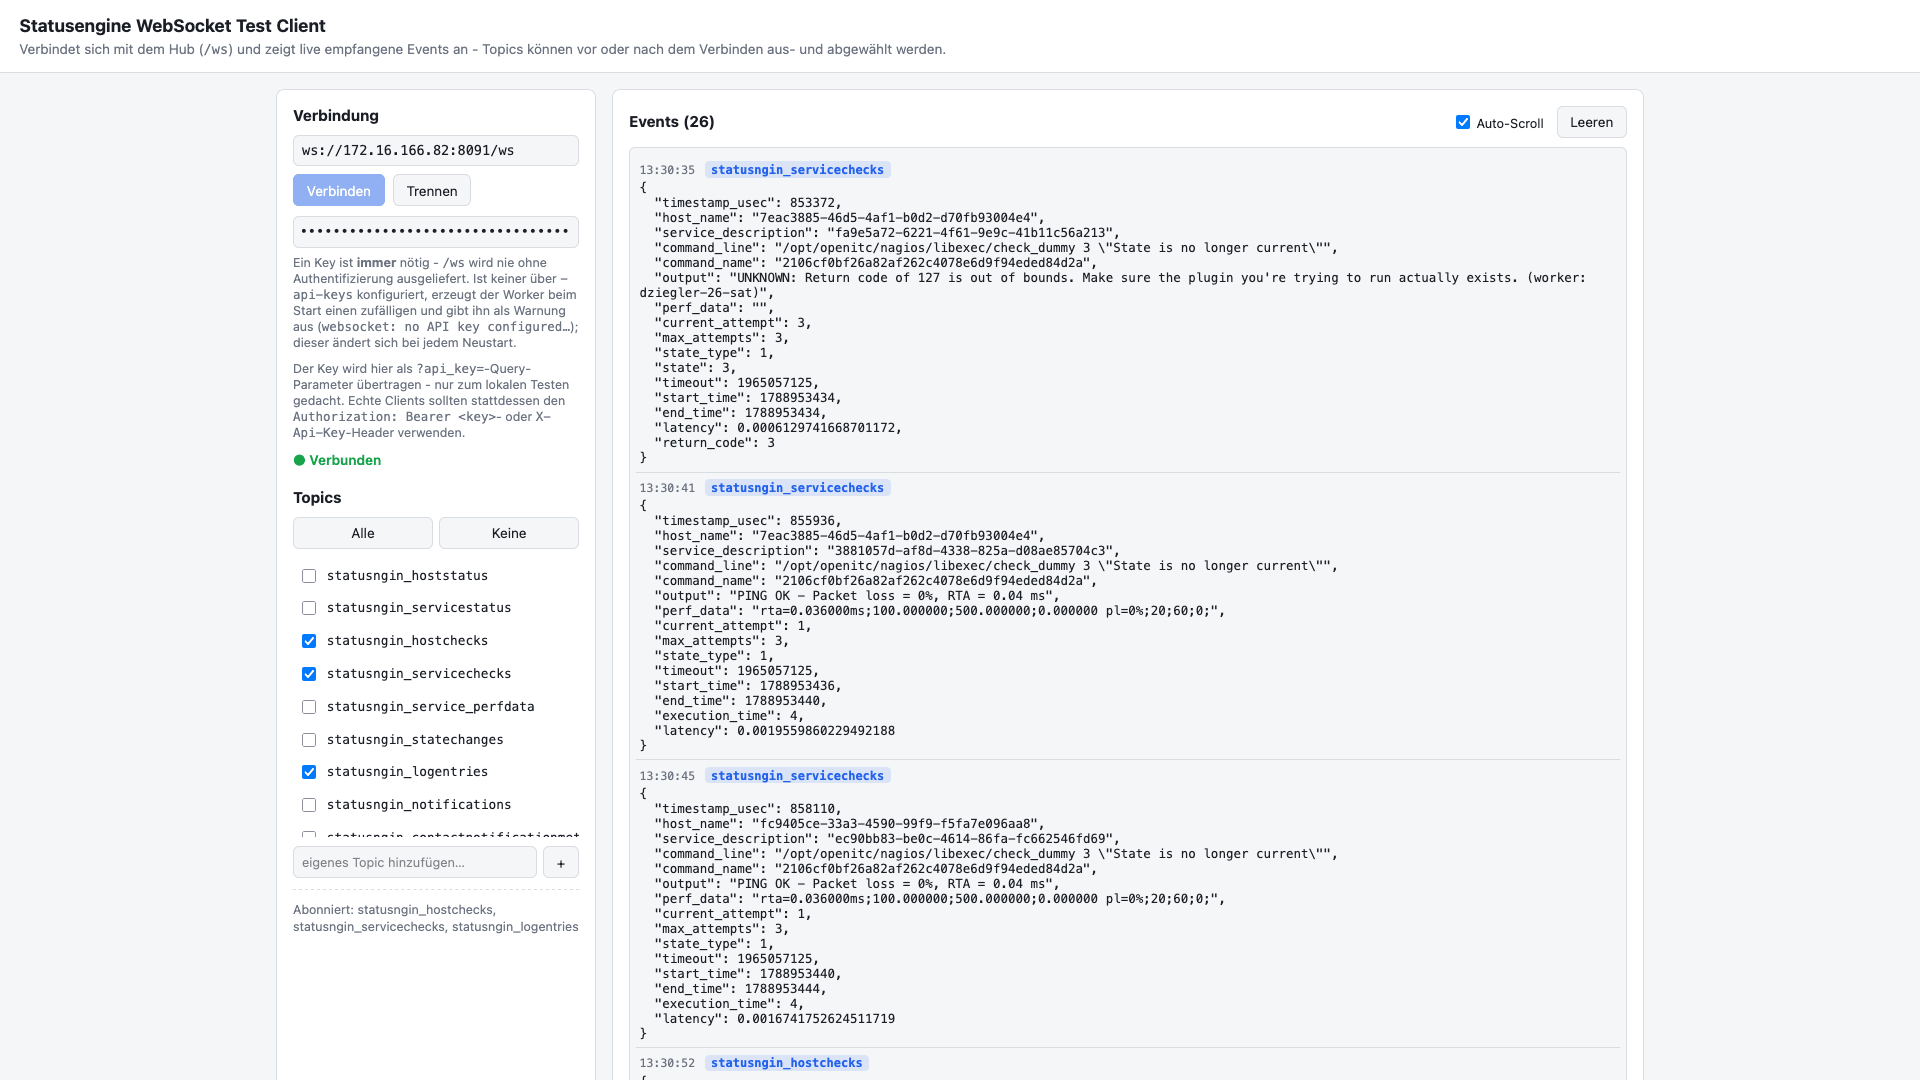
The Web Example Client demonstrates how to connect to the WebSocket server and updating subscriptions on the fly.
WebSocket example Clients
Web Client
The example Web Client can be downloaded from GitHub
and saved as ws-test-client.html. Drag it into a web browser to run the example client.
Python Client
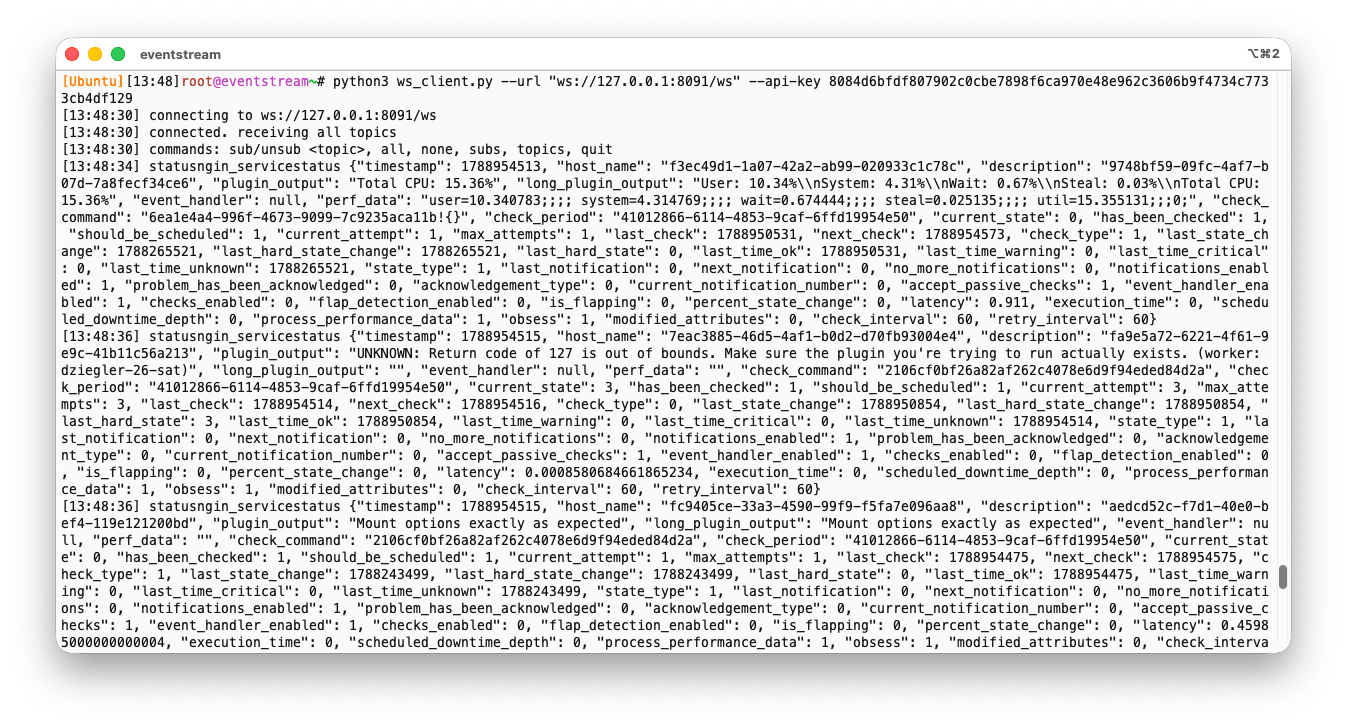
The example Python Client can be downloaded from GitHub
and saved as ws_client.py. Run it with python ws_client.py to start the example client. The Python client depends on websockets library,
which can be installed with pip install websockets.
Use --help to see all available command-line options for the Python client.
cURL Client
This is a simple example using curl (8.11.0 or newer).
curl --no-progress-meter --no-buffer -T . -N \
     -H "Authorization: Bearer <api-key>" \
     ws://127.0.0.1:8091/ws
-N/--no-buffer: Disables output buffering so you see incoming messages instantly.-T .: Tells curl to upload data fromstdincontinuously (allowing you to type messages into the terminal).
By default, this curl example will subscribe to all topics. To change the subscription, past {"subscribe": ["statusngin_servicechecks"]} and press Return. You can also use {"unsubscribe": ["statusngin_servicechecks"]} to stop receiving events for a specific topic.
Using an Reverse Proxy
When using a reverse proxy, you need to ensure that WebSocket connections are properly forwarded to the backend server. openITCOCKPIT is using Nginx as web server, so the reverse proxy configuration example above is for Nginx.
Extending the Default Virtual Host
Port 80 and 443 are already used by the default virtual host to serve openITCOCKPIT itself.
In case you want to extend the default virtual host, you need to place the configuration in the file: /etc/nginx/openitc/custom.conf.
location /eventstream {
    proxy_pass http://127.0.0.1:8091/ws;

    proxy_http_version 1.1;
    proxy_set_header Upgrade $http_upgrade;
    proxy_set_header Connection "Upgrade";

    proxy_set_header Host $host;
    proxy_set_header X-Real-IP $remote_addr;
    proxy_set_header X-Forwarded-For $proxy_add_x_forwarded_for;
    proxy_set_header X-Forwarded-Proto $scheme;

    proxy_read_timeout 600s;
    proxy_send_timeout 600s;
}
To apply the changes, reload the Nginx configuration with:
systemctl reload nginx
The Event Stream is now reachable at: wss://<host>/eventstream. For example using curl. Do not add the -T . parameter in this case.
curl -k --no-progress-meter --no-buffer -H "Authorization: Bearer <api-key>" wss://192.168.56.2/eventstream
New Virtual Host Configuration
In case you want to create a new virtual host for the Event Stream, you can use the following Nginx configuration example.
For example, you can paste the following configuration into a new file under /etc/nginx/sites-enabled/
server {
    listen 9999;

    location /ws {
        proxy_pass http://127.0.0.1:8091/ws;

        proxy_http_version 1.1;
        proxy_set_header Upgrade $http_upgrade;
        proxy_set_header Connection "Upgrade";

        proxy_set_header Host $host;
        proxy_set_header X-Real-IP $remote_addr;
        proxy_set_header X-Forwarded-For $proxy_add_x_forwarded_for;
        proxy_set_header X-Forwarded-Proto $scheme;

        proxy_read_timeout 600s;
        proxy_send_timeout 600s;
    }
}
To apply the changes, reload the Nginx configuration with:
systemctl reload nginx
The Event Stream is now reachable at: ws://<host>:9999/ws. For example using curl. Do not add the -T . parameter in this case.
curl --no-progress-meter --no-buffer -H "Authorization: Bearer <api-key>" ws://192.168.56.2:9999/ws
Event Stream Topics
Every server-to-client frame contains a topic and a payload. The payload is
always an array; every array entry has the model listed for its topic below.
All time fields with the int64 format contain Unix timestamps. Fields ending in
_usec contain the microsecond component of their associated time field.
statusngin_hoststatus
Model: HostStatusEvent. Current status of a host.
| Field | Type | Description |
|---|---|---|
timestamp |
integer (int64) | Time the status was reported. |
name |
string | Host name. |
plugin_output |
string | Plugin output. |
long_plugin_output |
string | Long plugin output. |
event_handler |
string or null | Configured event handler command. |
perf_data |
string | Raw Nagios/Naemon performance data. |
check_command |
string | Check command. |
check_period |
string | Check time period. |
current_state |
integer | 0 = UP, 1 = DOWN, 2 = UNREACHABLE. |
has_been_checked |
integer | 0 or 1. |
should_be_scheduled |
integer | 0 or 1. |
current_attempt |
integer | Current check attempt. |
max_attempts |
integer | Maximum check attempts. |
last_check |
integer (int64) | Last check time. |
next_check |
integer (int64) | Next check time. |
check_type |
integer | 0 = active, 1 = passive. |
last_state_change |
integer (int64) | Last state-change time. |
last_hard_state_change |
integer (int64) | Last hard-state-change time. |
last_hard_state |
integer | Same coding as current_state. |
last_time_up |
integer (int64) | Last UP time. |
last_time_down |
integer (int64) | Last DOWN time. |
last_time_unreachable |
integer (int64) | Last UNREACHABLE time. |
state_type |
integer | 0 = SOFT, 1 = HARD. |
last_notification |
integer (int64) | Last notification time. |
next_notification |
integer (int64) | Next notification time. |
no_more_notifications |
integer | 0 or 1. |
notifications_enabled |
integer | 0 or 1. |
problem_has_been_acknowledged |
integer | 0 or 1. |
acknowledgement_type |
integer | Acknowledgement type. |
current_notification_number |
integer | Current notification number. |
accept_passive_checks |
integer | 0 or 1. |
event_handler_enabled |
integer | 0 or 1. |
checks_enabled |
integer | 0 or 1. |
flap_detection_enabled |
integer | 0 or 1. |
is_flapping |
integer | 0 or 1. |
percent_state_change |
float64 | Percentage state change. |
latency |
float64 | Check latency. |
execution_time |
float64 | Check execution time. |
scheduled_downtime_depth |
integer | Number of active overlapping downtimes. |
process_performance_data |
integer | 0 or 1. |
obsess |
integer | 0 or 1. |
modified_attributes |
integer | Modified-attributes bitmask. |
check_interval |
float64 | Normal check interval. |
retry_interval |
float64 | Retry check interval. |
statusngin_servicestatus
Model: ServiceStatusEvent. Current status of a service.
| Field | Type | Description |
|---|---|---|
timestamp |
integer (int64) | Time the status was reported. |
host_name |
string | Host UUID. |
description |
string | Service UUID. |
plugin_output |
string | Plugin output. |
long_plugin_output |
string | Long plugin output. |
event_handler |
string or null | Configured event handler command. |
perf_data |
string | Raw performance data. |
check_command |
string | Check command. |
check_period |
string | Check time period. |
current_state |
integer | 0 = OK, 1 = WARNING, 2 = CRITICAL, 3 = UNKNOWN. |
has_been_checked |
integer | Whether the service has been checked. |
should_be_scheduled |
integer | Whether checks should be scheduled. |
current_attempt |
integer | Current check attempt. |
max_attempts |
integer | Maximum check attempts. |
last_check |
integer (int64) | Last check time. |
next_check |
integer (int64) | Next check time. |
check_type |
integer | 0 = active, 1 = passive. |
last_state_change |
integer (int64) | Last state-change time. |
last_hard_state_change |
integer (int64) | Last hard-state-change time. |
last_hard_state |
integer | Last hard state. |
last_time_ok |
integer (int64) | Last OK time. |
last_time_warning |
integer (int64) | Last WARNING time. |
last_time_critical |
integer (int64) | Last CRITICAL time. |
last_time_unknown |
integer (int64) | Last UNKNOWN time. |
state_type |
integer | 0 = SOFT, 1 = HARD. |
last_notification |
integer (int64) | Last notification time. |
next_notification |
integer (int64) | Next notification time. |
no_more_notifications |
integer | Whether further notifications are disabled. |
notifications_enabled |
integer | Whether notifications are enabled. |
problem_has_been_acknowledged |
integer | Whether the problem is acknowledged. |
acknowledgement_type |
integer | Acknowledgement type. |
current_notification_number |
integer | Current notification number. |
accept_passive_checks |
integer | Whether passive checks are accepted. |
event_handler_enabled |
integer | Whether the event handler is enabled. |
checks_enabled |
integer | Whether checks are enabled. |
flap_detection_enabled |
integer | Whether flap detection is enabled. |
is_flapping |
integer | Whether the service is flapping. |
percent_state_change |
float64 | Percentage state change. |
latency |
float64 | Check latency. |
execution_time |
float64 | Check execution time. |
scheduled_downtime_depth |
integer | Number of active overlapping downtimes. |
process_performance_data |
integer | Whether performance data is processed. |
obsess |
integer | Whether obsessive processing is enabled. |
modified_attributes |
integer | Modified-attributes bitmask. |
check_interval |
float64 | Normal check interval. |
retry_interval |
float64 | Retry check interval. |
statusngin_hostchecks
Model: HostCheckEvent. A completed host check result.
| Field | Type | Description |
|---|---|---|
timestamp_usec |
integer | Microseconds alongside start_time. |
host_name |
string | Host UUID. |
command_line |
string | Executed command line. |
command_name |
string | Check command name. |
output |
string | Plugin output. |
long_output |
string | Long plugin output. |
perf_data |
string | Raw performance data. |
check_type |
integer | 0 = active, 1 = passive. |
current_attempt |
integer | Current check attempt. |
max_attempts |
integer | Maximum check attempts. |
state_type |
integer | 0 = SOFT, 1 = HARD. |
state |
integer | 0 = UP, 1 = DOWN, 2 = UNREACHABLE. |
timeout |
integer | Configured timeout. |
start_time |
integer (int64) | Check start time. |
end_time |
integer (int64) | Check end time. |
early_timeout |
integer | 0 or 1. |
execution_time |
float64 | Check execution time. |
latency |
float64 | Check latency. |
return_code |
integer | Plugin return code. |
statusngin_servicechecks
Model: ServiceCheckEvent. A completed service check result.
| Field | Type | Description |
|---|---|---|
timestamp_usec |
integer | Microseconds alongside start_time. |
host_name |
string | Host UUID. |
service_description |
string | Service UUID. |
command_line |
string | Executed command line. |
command_name |
string | Check command name. |
output |
string | Plugin output. |
long_output |
string | Long plugin output. |
perf_data |
string | Raw performance data. |
check_type |
integer | 0 = active, 1 = passive. |
current_attempt |
integer | Current check attempt. |
max_attempts |
integer | Maximum check attempts. |
state_type |
integer | 0 = SOFT, 1 = HARD. |
state |
integer | 0 = OK, 1 = WARNING, 2 = CRITICAL, 3 = UNKNOWN. |
timeout |
integer | Configured timeout. |
start_time |
integer (int64) | Check start time. |
end_time |
integer (int64) | Check end time. |
early_timeout |
integer | 0 or 1. |
execution_time |
float64 | Check execution time. |
latency |
float64 | Check latency. |
return_code |
integer | Plugin return code. |
statusngin_service_perfdata
Model: ServicePerfdataEvent. Performance data for a service. Only the fields
listed below are populated on this topic.
| Field | Type | Description |
|---|---|---|
host_name |
string | Host UUID. |
service_description |
string | Service UUID. |
perf_data |
string | Raw, unparsed Nagios/Naemon performance data. |
start_time |
integer (int64) | Check start time. |
statusngin_statechanges
Model: StateChangeEvent. A host or service state-history event.
| Field | Type | Description |
|---|---|---|
timestamp |
integer (int64) | Event time. |
timestamp_usec |
integer | Microsecond component of the event time. |
host_name |
string | Host UUID. |
service_description |
string | Service UUID; empty for a host event. |
output |
string | Plugin output. |
long_output |
string | Long plugin output. |
statechange_type |
integer | 0 = host, 1 = service. |
state |
integer | Current state; coding depends on statechange_type. |
state_type |
integer | 0 = SOFT, 1 = HARD. |
current_attempt |
integer | Current check attempt. |
max_attempts |
integer | Maximum check attempts. |
last_state |
integer | Previous state. |
last_hard_state |
integer | Previous hard state. |
statusngin_logentries
Model: LogEntryEvent. A raw Naemon/Nagios log entry.
| Field | Type | Description |
|---|---|---|
entry_time |
integer (int64) | Log entry time. |
data_type |
integer | Naemon/Nagios NSLOG_* code. |
data |
string | Log line text. |
statusngin_notifications
Model: NotificationEvent. A completed notification.
| Field | Type | Description |
|---|---|---|
type |
integer | Always 601 (NEBTYPE_NOTIFICATION_END). |
timestamp_usec |
integer | Microsecond component of the event time. |
host_name |
string | Host UUID. |
service_description |
string | Service UUID; empty for a host notification. |
output |
string | Plugin output. |
long_output |
string | Long plugin output. |
ack_author |
string | Set when an acknowledgement triggered the notification. |
ack_data |
string | Acknowledgement comment. |
notification_type |
integer | Naemon/Nagios notification type code. |
start_time |
integer (int64) | Notification start time. |
end_time |
integer (int64) | Notification end time. |
reason_type |
integer | Naemon/Nagios notification reason code. |
state |
integer | Notified state; coding depends on host or service. |
escalated |
integer | 0 or 1. |
contacts_notified |
integer | Number of contacts actually notified. |
statusngin_contactnotificationmethod
Model: ContactNotificationMethodEvent. A completed delivery to one contact.
| Field | Type | Description |
|---|---|---|
type |
integer | Always 605 (NEBTYPE_CONTACTNOTIFICATIONMETHOD_END). |
timestamp |
integer (int64) | Event time. |
timestamp_usec |
integer | Microsecond component of the event time. |
host_name |
string | Host UUID. |
service_description |
string | Service UUID; empty for a host notification. |
output |
string | Plugin output. |
ack_author |
string | Acknowledgement author. |
ack_data |
string | Acknowledgement comment. |
contact_name |
string | Contact receiving the notification. |
command_name |
string | Notification command used. |
command_args |
string or null | Notification command arguments. |
reason_type |
integer | Naemon/Nagios notification reason code. |
state |
integer | Notified state. |
start_time |
integer (int64) | Delivery start time. |
end_time |
integer (int64) | Delivery end time. |
statusngin_acknowledgements
Model: AcknowledgementEvent. An acknowledgement on a host or service.
| Field | Type | Description |
|---|---|---|
entry_time |
integer (int64) | Acknowledgement time. |
entry_time_usec |
integer | Microsecond component of entry_time. |
host_name |
string | Host UUID. |
service_description |
string | Service UUID; empty for a host acknowledgement. |
state |
integer | Acknowledged state. |
author_name |
string | Acknowledgement author. |
comment_data |
string | Acknowledgement comment. |
acknowledgement_type |
integer | 1 = normal, 2 = sticky. |
is_sticky |
integer | 0 or 1. |
persistent_comment |
integer | 0 or 1. |
notify_contacts |
integer | 0 or 1; contacts were notified about the acknowledgement. |
statusngin_downtimes
Model: DowntimeEvent. Covers the complete downtime lifecycle.
| Field | Type | Description |
|---|---|---|
type |
integer | 1100 = ADD, 1101 = DELETE, 1102 = LOAD, 1103 = START, 1104 = STOP. |
flags |
integer | Broker flags. |
attr |
integer | For STOP only: 1 = normal expiry, 2 = cancelled early; otherwise 0. |
timestamp |
integer (int64) | Event time. |
timestamp_usec |
integer | Microsecond component of the event time. |
downtime |
object | Downtime details, shown below. |
downtime has the following fields:
| Field | Type | Description |
|---|---|---|
host_name |
string | Host UUID. |
service_description |
string | Service UUID; empty for a host downtime. |
author_name |
string | Downtime author. |
comment_data |
string | Downtime comment. |
downtime_type |
integer | 1 = service, 2 = host. |
entry_time |
integer (int64) | Time the downtime was scheduled. |
start_time |
integer (int64) | Scheduled start time. |
end_time |
integer (int64) | Scheduled end time. |
triggered_by |
integer | ID of the triggering downtime, or 0. |
downtime_id |
integer | Downtime ID. |
fixed |
integer | 0 = flexible, 1 = fixed. |
duration |
integer | Duration in seconds; meaningful for flexible downtimes. |
statusngin_core_restart
Model: CoreRestartEvent. Sent when the monitoring core restarts or reloads its
configuration.
| Field | Type | Description |
|---|---|---|
object_type |
integer | Always 102. |
timestamp |
integer (int64) | Restart time; currently 0 when the core does not provide it. |
Metrics
The Statusengine Worker exposes Prometheus metrics for the WebSocket Event Stream. The metrics endpoint is unauthenticated by design and should only be reachable by trusted monitoring systems.
| Metric | Type | Description |
|---|---|---|
statusengine_websocket_clients_active |
gauge | Number of currently connected WebSocket clients. |
statusengine_websocket_messages_broadcasted_total |
counter | Events successfully handed to client send buffers. This counts events, not frames. |
statusengine_websocket_frames_sent_total |
counter | Frames handed to clients. One frame contains one queue job and can contain multiple events. |
statusengine_websocket_messages_dropped_total |
counter | Events dropped because an individual client's send buffer was full. A drop affects only that client, but can drop a complete frame containing multiple events. |
statusengine_websocket_publish_dropped_total |
counter | Events dropped because the Hub's inbound buffer was full. This affects all connected clients and should be alerted on. |
External Commands API
The Statusengine Worker also provides the writable POST /commands endpoint.
It publishes Naemon external commands to the statusngin_cmd queue, where they
are processed by the Statusengine broker module.
Danger
The /commands endpoint grants write access to the Monitoring system.
Ensure that only trusted clients have access to this endpoint.
This endpoint is separate from the WebSocket Event Stream. It has its own listen address and its own API keys.
Configuration
The configuration is handled by the Configuration File Editor of openITCOCKPIT.
Navigate to System → Config file editor and edit the file /opt/openitc/etc/statusengine/worker-config.yml.
command_listen_addr: Control the listen address for thePOST /commandsendpoint.command_api_keys: Separate API keys for the External Commands API. (max 25 keys can be configured)
Authentication
Send a key from command_api_keys in either HTTP header:
| Header | Example |
|---|---|
Authorization |
Authorization: Bearer <command-api-key> |
X-Api-Key |
X-Api-Key: <command-api-key> |
The api_key query parameter is not supported for this endpoint. A missing or
invalid key returns HTTP 401.
Request format
The request body contains either one command with Command and Data, or a
messages array for a bulk request. Command and Data are case-sensitive.
Do not combine messages with Command or Data in one request. A bulk may
contain up to 50 commands of different types.
Command |
Data |
|---|---|
check_result |
Object with host_name and output (required), plus optional service_description, long_output, perf_data, check_type, return_code, start_time, end_time, early_timeout, latency, and exited_ok. Omit service_description for a host check. |
schedule_check |
Object with host_name and non-zero schedule_time (required), plus optional service_description. Omit service_description for a host check. |
delete_downtime |
Object with required host_name, plus optional service_description, start_time, end_time, and comment. |
raw |
A Naemon external-command string. The worker adds the required [<unix timestamp>] prefix when it is absent. |
check_result model
Submit a passive result for a host or service. Omit service_description for a
host result.
| Field | Type | Required | Description |
|---|---|---|---|
host_name |
string | Yes | Host UUID. |
service_description |
string | No | Service UUID. Omit for a host result. |
output |
string | Yes | Plugin output. |
long_output |
string | No | Long plugin output. |
perf_data |
string | No | Raw Nagios/Naemon performance data. |
check_type |
integer | No | Check type. |
return_code |
integer | No | Plugin return code. |
start_time |
integer (int64) | No | Check start time as a Unix timestamp. |
end_time |
integer (int64) | No | Check end time as a Unix timestamp. |
early_timeout |
integer | No | Whether the check timed out early. |
latency |
float64 | No | Check latency. |
exited_ok |
integer | No | Whether the plugin exited successfully. |
schedule_check model
Schedule a host or service check. Omit service_description to schedule a host
check. schedule_time must not be 0.
| Field | Type | Required | Description |
|---|---|---|---|
host_name |
string | Yes | Host UUID. |
service_description |
string | No | Service UUID. Omit for a host check. |
schedule_time |
integer (int64) | Yes | Unix timestamp at which the check is scheduled. |
delete_downtime model
Delete a scheduled downtime for a host or service.
| Field | Type | Required | Description |
|---|---|---|---|
host_name |
string | Yes | Host UUID. |
service_description |
string | No | Service UUID. Omit for a host downtime. |
start_time |
integer (int64) | No | Scheduled downtime start time as a Unix timestamp. |
end_time |
integer (int64) | No | Scheduled downtime end time as a Unix timestamp. |
comment |
string | No | Downtime comment. |
raw model
The Data value is a string containing a Naemon external command. The worker
adds the leading [<unix timestamp>] when it is not provided.
| Field | Type | Required | Description |
|---|---|---|---|
Data |
string | Yes | Naemon external-command string. |
For example, submit a passive service result with curl:
curl --request POST http://127.0.0.1:8092/commands \
    -H "Authorization: Bearer 027bf8c045d46ef14d8c59336c9d5045d9ae51d614fc047f56b625863e9774d1" \
    -H "Content-Type: application/json" \
    --data '{
        "Command": "check_result",
        "Data": {
            "host_name": "c36b8048-93ce-4385-ac19-ab5c90574b77",
            "service_description": "74fd8f59-1348-4e16-85f0-4a5c57c7dd62",
            "output": "Warning - This is an example",
            "return_code": 1
        }
    }'
A successful request returns HTTP 202 Accepted and the number of commands
published to the broker, for example {"accepted": 1}. This confirms that the
worker handed the command to the message broker; it does not confirm that
Naemon has executed the command. Invalid requests return 400, prohibited
commands return 403, and a broker failure returns 503 so the client can
retry.