Monitoring with Prometheus CE
What is Prometheus?
Prometheus is an open-source monitoring system originally developed at SoundCloud. Today, it is an independently developed project without ties to any company.
In contrast to Nagios, with Prometheus there is no status generated via an exit code or similar. Prometheus is a monitoring system that was created exclusively to collect and monitor metrics. Or to put it plainly: It only exists to process numbers.
The status is obtained from conditions and queries run against the metrics using PromQL.
A typical alert rule would be, for example
- alert: ram_at_80_percent
  expr:  node_memory_MemAvailable_bytes / node_memory_MemTotal_bytes * 100 > 80
  for: 15m
  labels:
    priority: "0"
    severity: "warning"
  annotations:
    summary: "RAM is filling up"
    description: "RAM on {{$labels.instance}} has been at 80% for 15 minutes."
If the metric "used memory in %" is above 80 % for more than 15 minutes, a "warning" alert is sent.
Exporters
Prometheus itself does not run any checks or plugins. Instead, entities called exporters must be installed on the system that needs to be monitored.
The exporters are small programs that provide a web server through which Prometheus can query the metrics. Similar to Nagios, there are countless community-developed exporters to monitor Linux, Windows, MySQL, Oracle DB, AWS, UniFi and pretty much anything else you can think of.
Prerequisites
To use Prometheus with openITCOCKPIT, you need an Community licence and must have installed the PrometheusModule.
openITCOCKPIT Community Licence is required
To get access to the community modules, you need to register your openITCOCKPIT instance using the free community licence.
In addition, the appropriate exporters must be installed on the target system to be monitored. A list of available exporters can be found on the Prometheus website
Creating an exporter in openITCOCKPIT
To create a Prometheus exporter in openITCOCKPIT, click Monitoring → Prometheus → Exporters in the main menu.
In the overview, click on the "New" button.
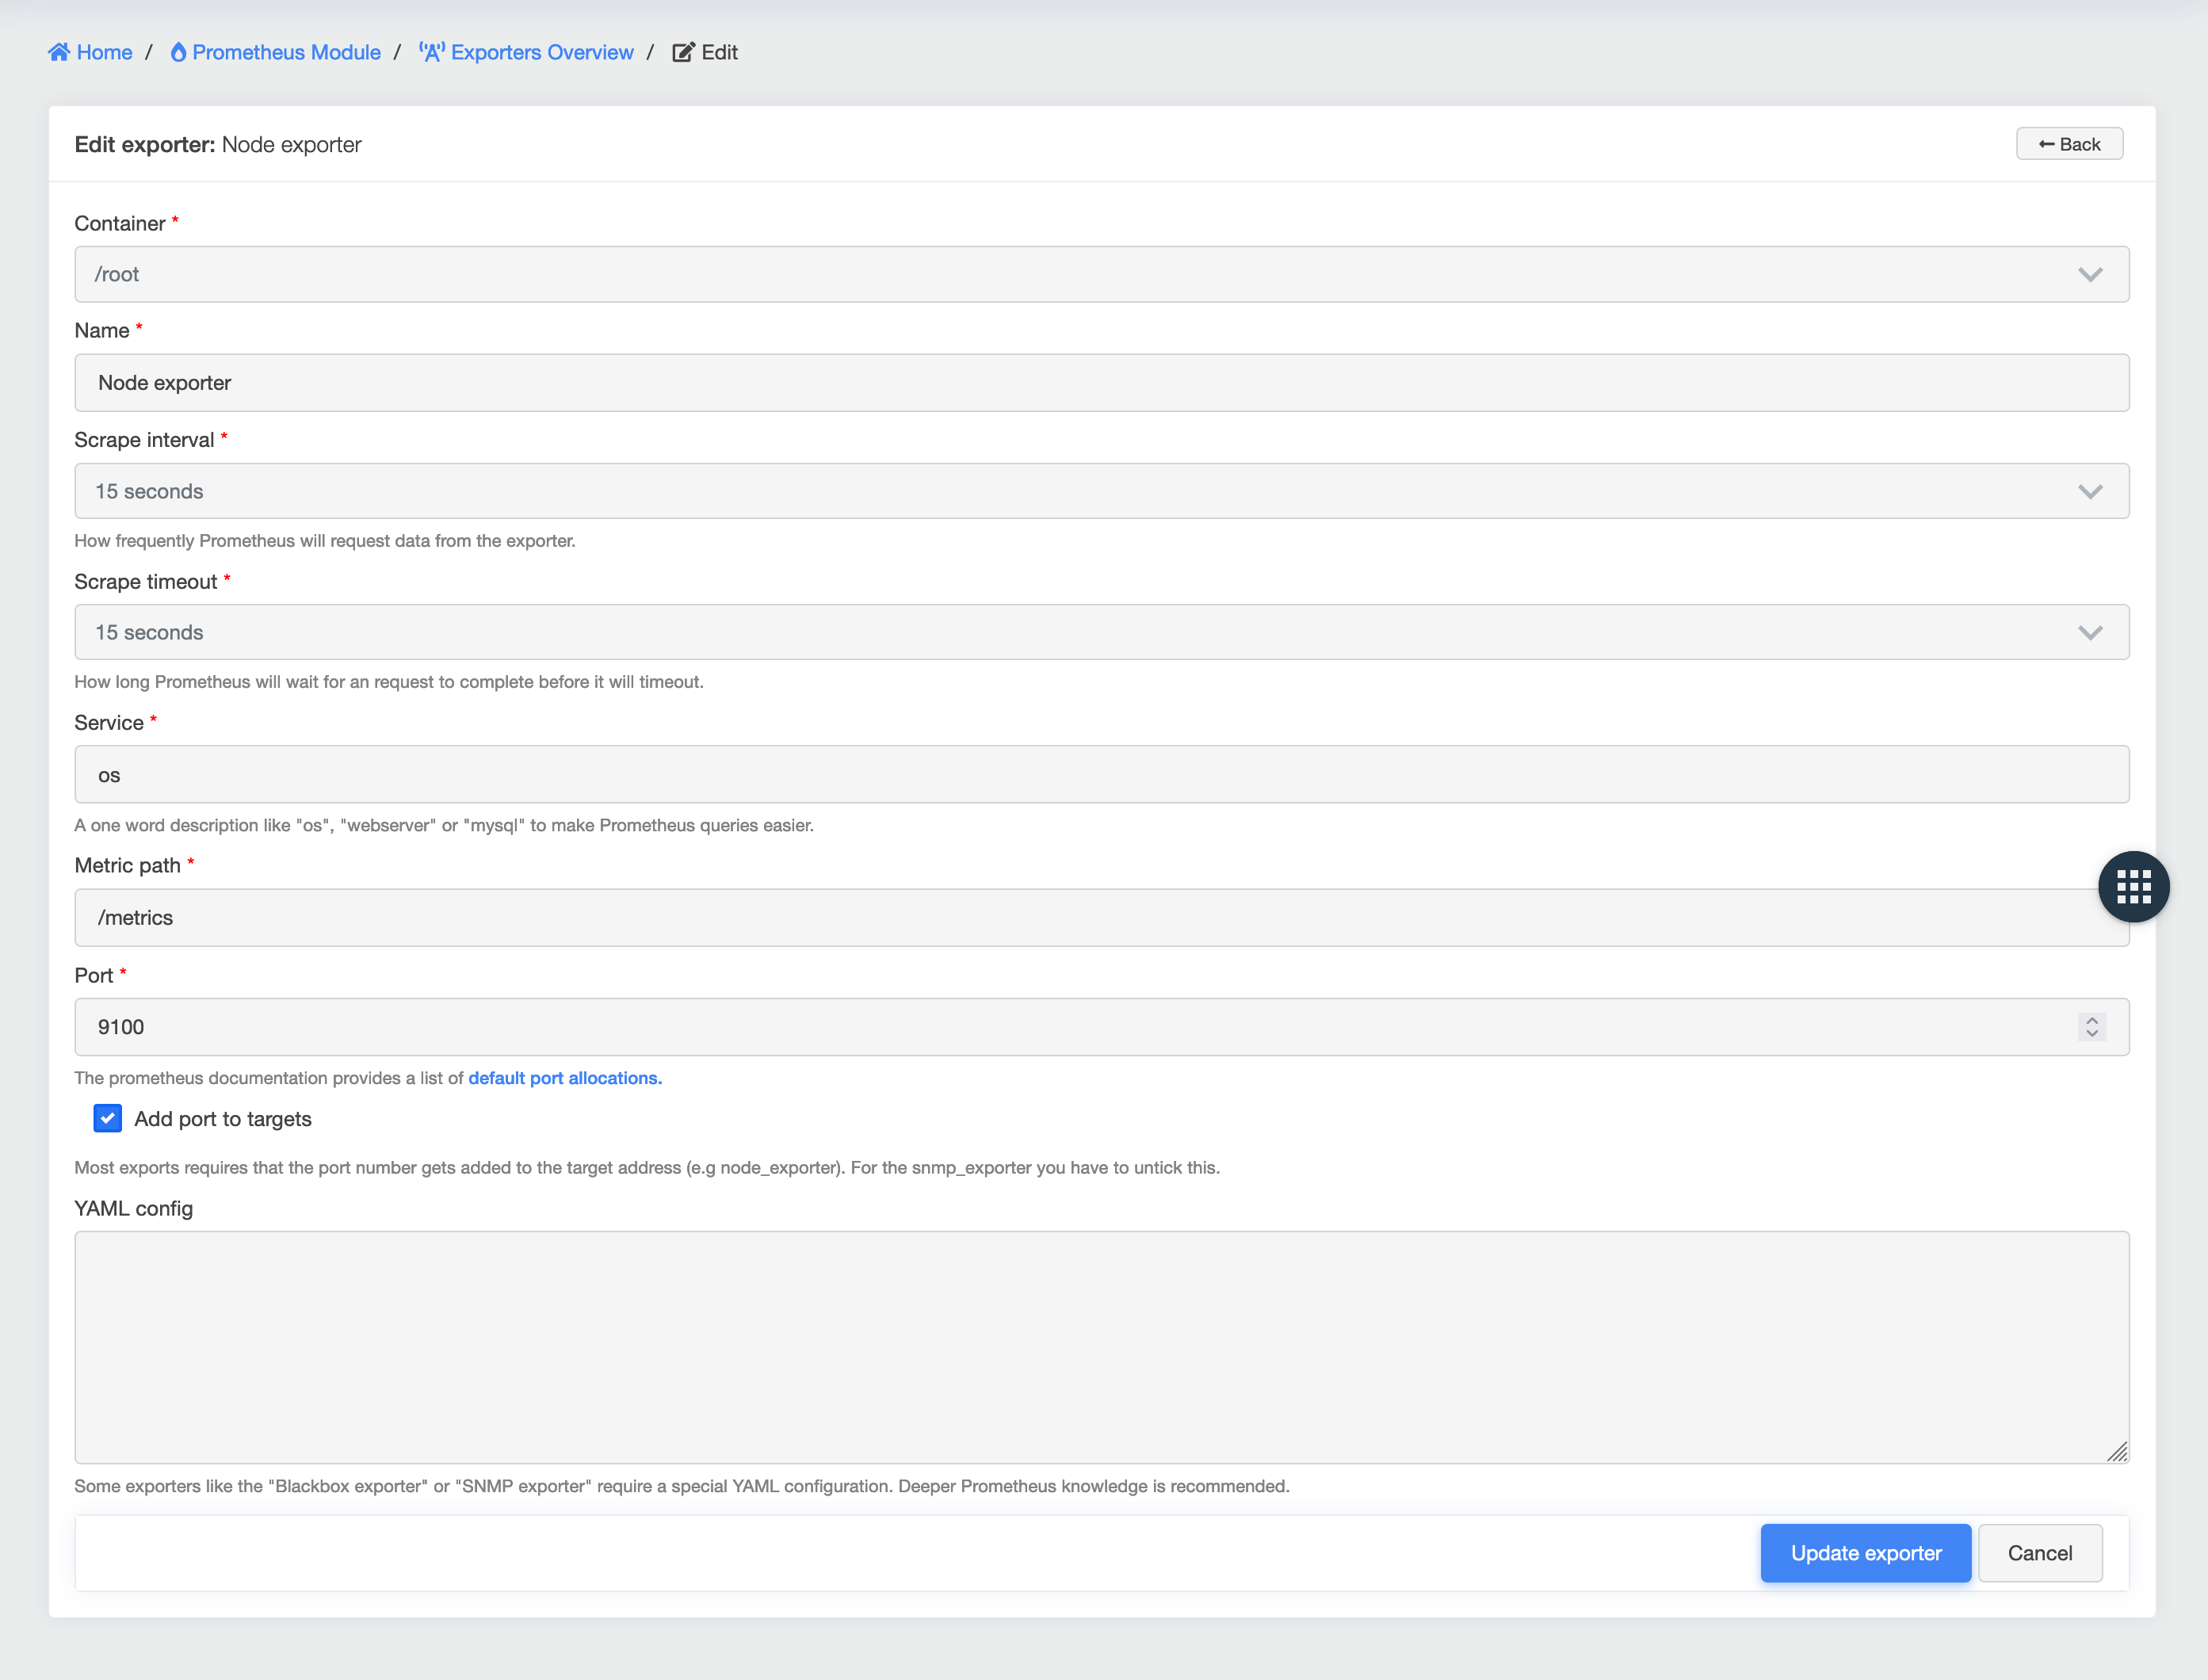
In the form that appears, enter a container and a name for the exporter.
The scrape interval defines the time interval at which Prometheus requests data from the exporter.
The scrape time limit defines how long Prometheus will wait for the exporter to respond.
The Service field is used by Prometheus as a description field for adding a tag to the metrics.
This is used for clarification when two or more exporters use the same name for metrics.
The metrics path defines the URL that the exporter on the monitored host uses to provide data. This path is usually always /metrics.
The port indicates the port on which the exporter is running.
Some exporters require special YAML configurations (e.g. Blackbox, SNMP and some others). The "YAML configuration" field is provided should this be needed.
Monitoring a host with Prometheus in openITCOCKPIT
As already described in the prerequisites, a corresponding exporter must be installed on the target host and created in openITCOCKPIT (but only if this differs from the exporters already available by default in openITCOCKPIT).
To monitor a host with Prometheus, either a new host must be created or an existing host must be edited.
At the bottom of the form you will find the configuration for the Prometheus exporter.
Once you have edited your host as required, make sure you save your changes.
Once this has been done, you will need to export your configuration.

Metrics, services and notifications
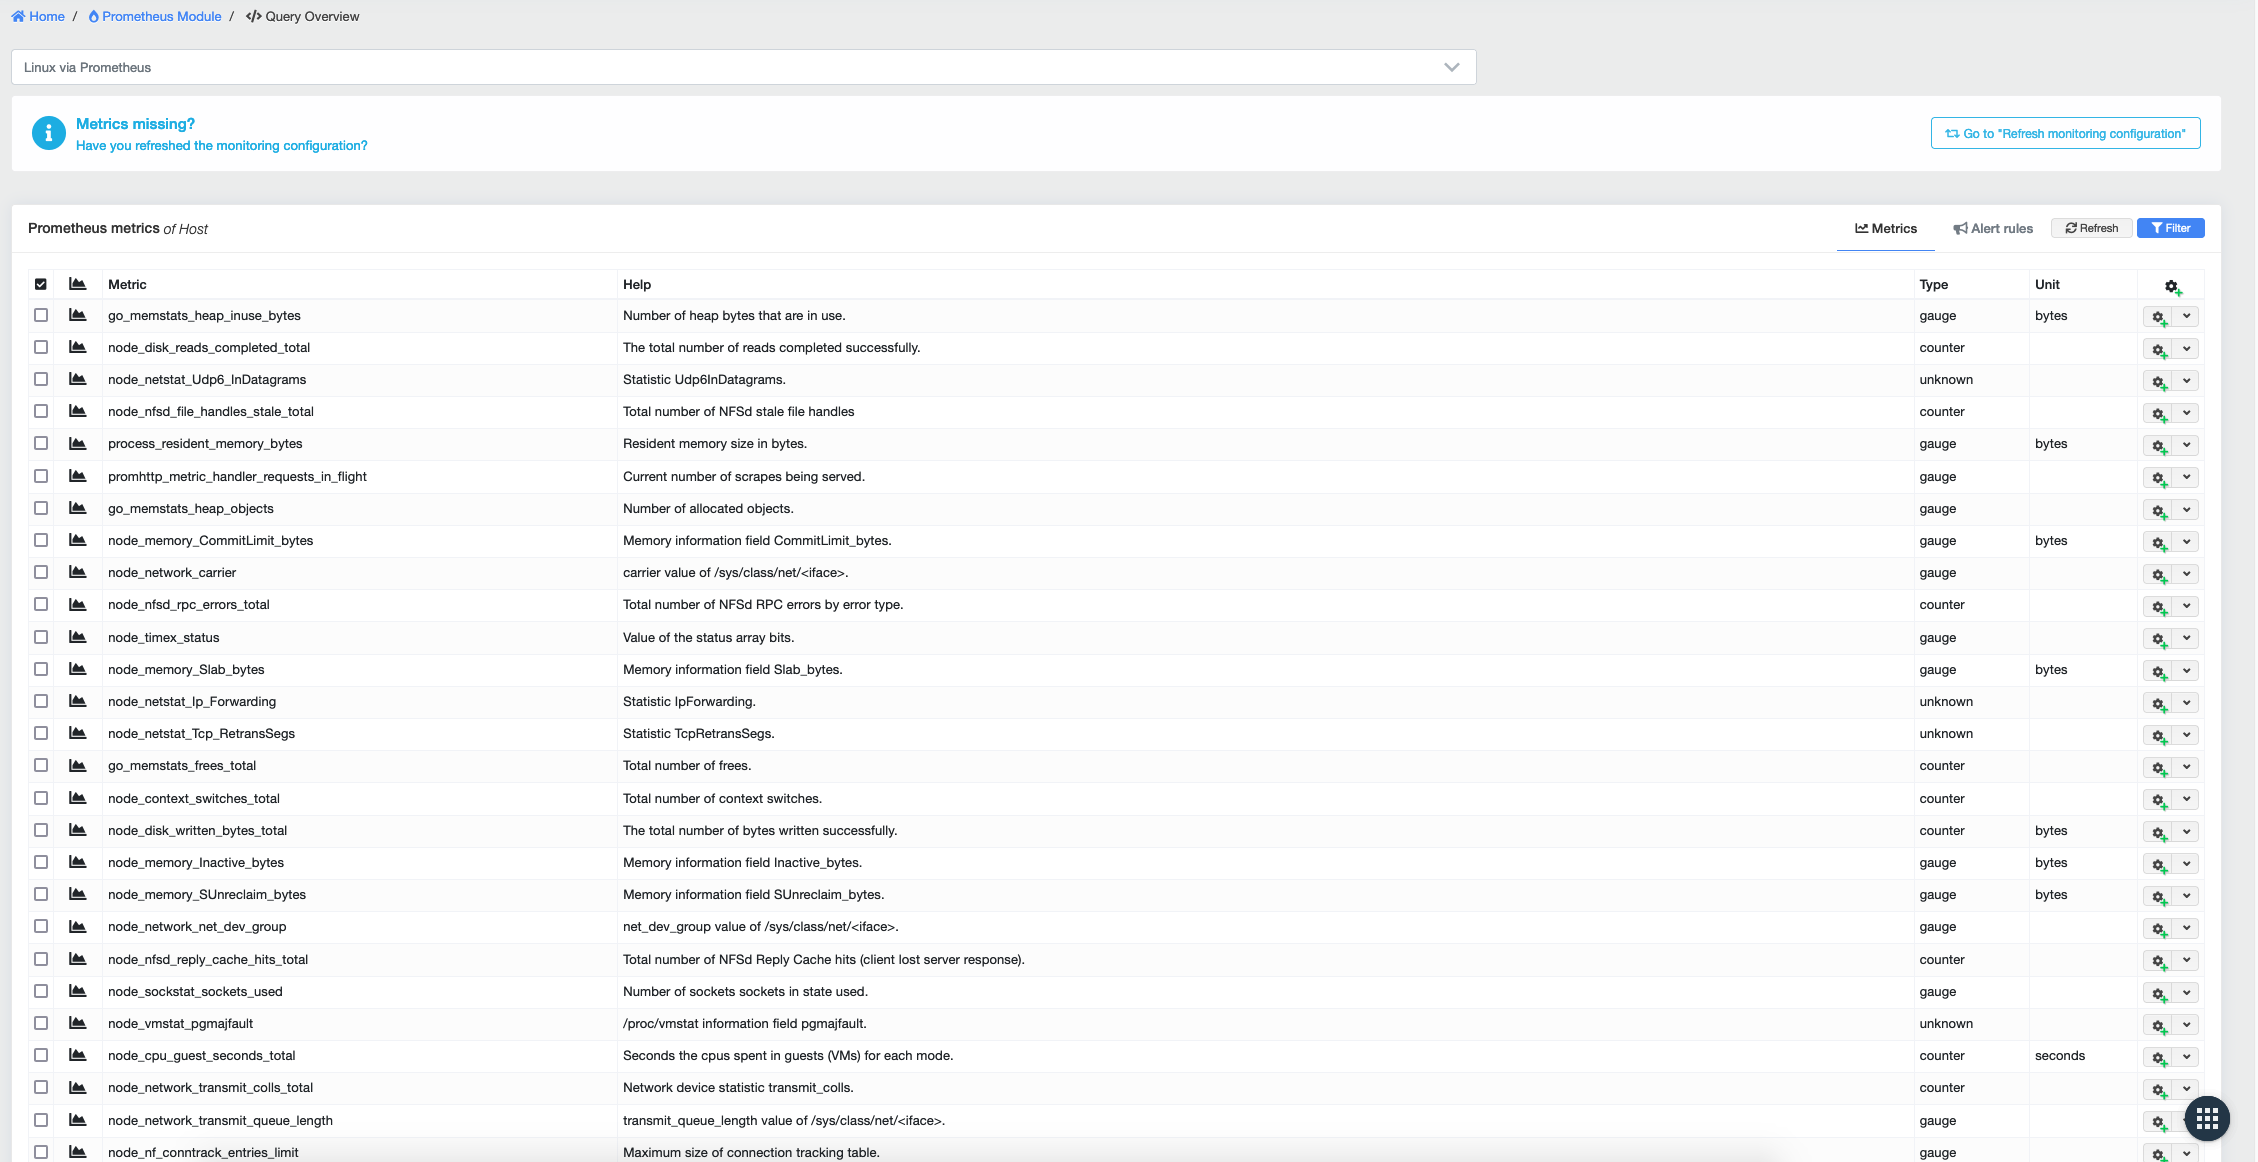
Now navigate to Monitoring → Prometheus → Query in the main menu and select your host from the drop-down list.
All metrics available through the exporter will be listed. All the metrics displayed will now be captured and stored by Prometheus.
Notifications
To set up notifications for the metrics, one or more services must be created.
To do this, select the desired metric and create the appropriate PromQL query.
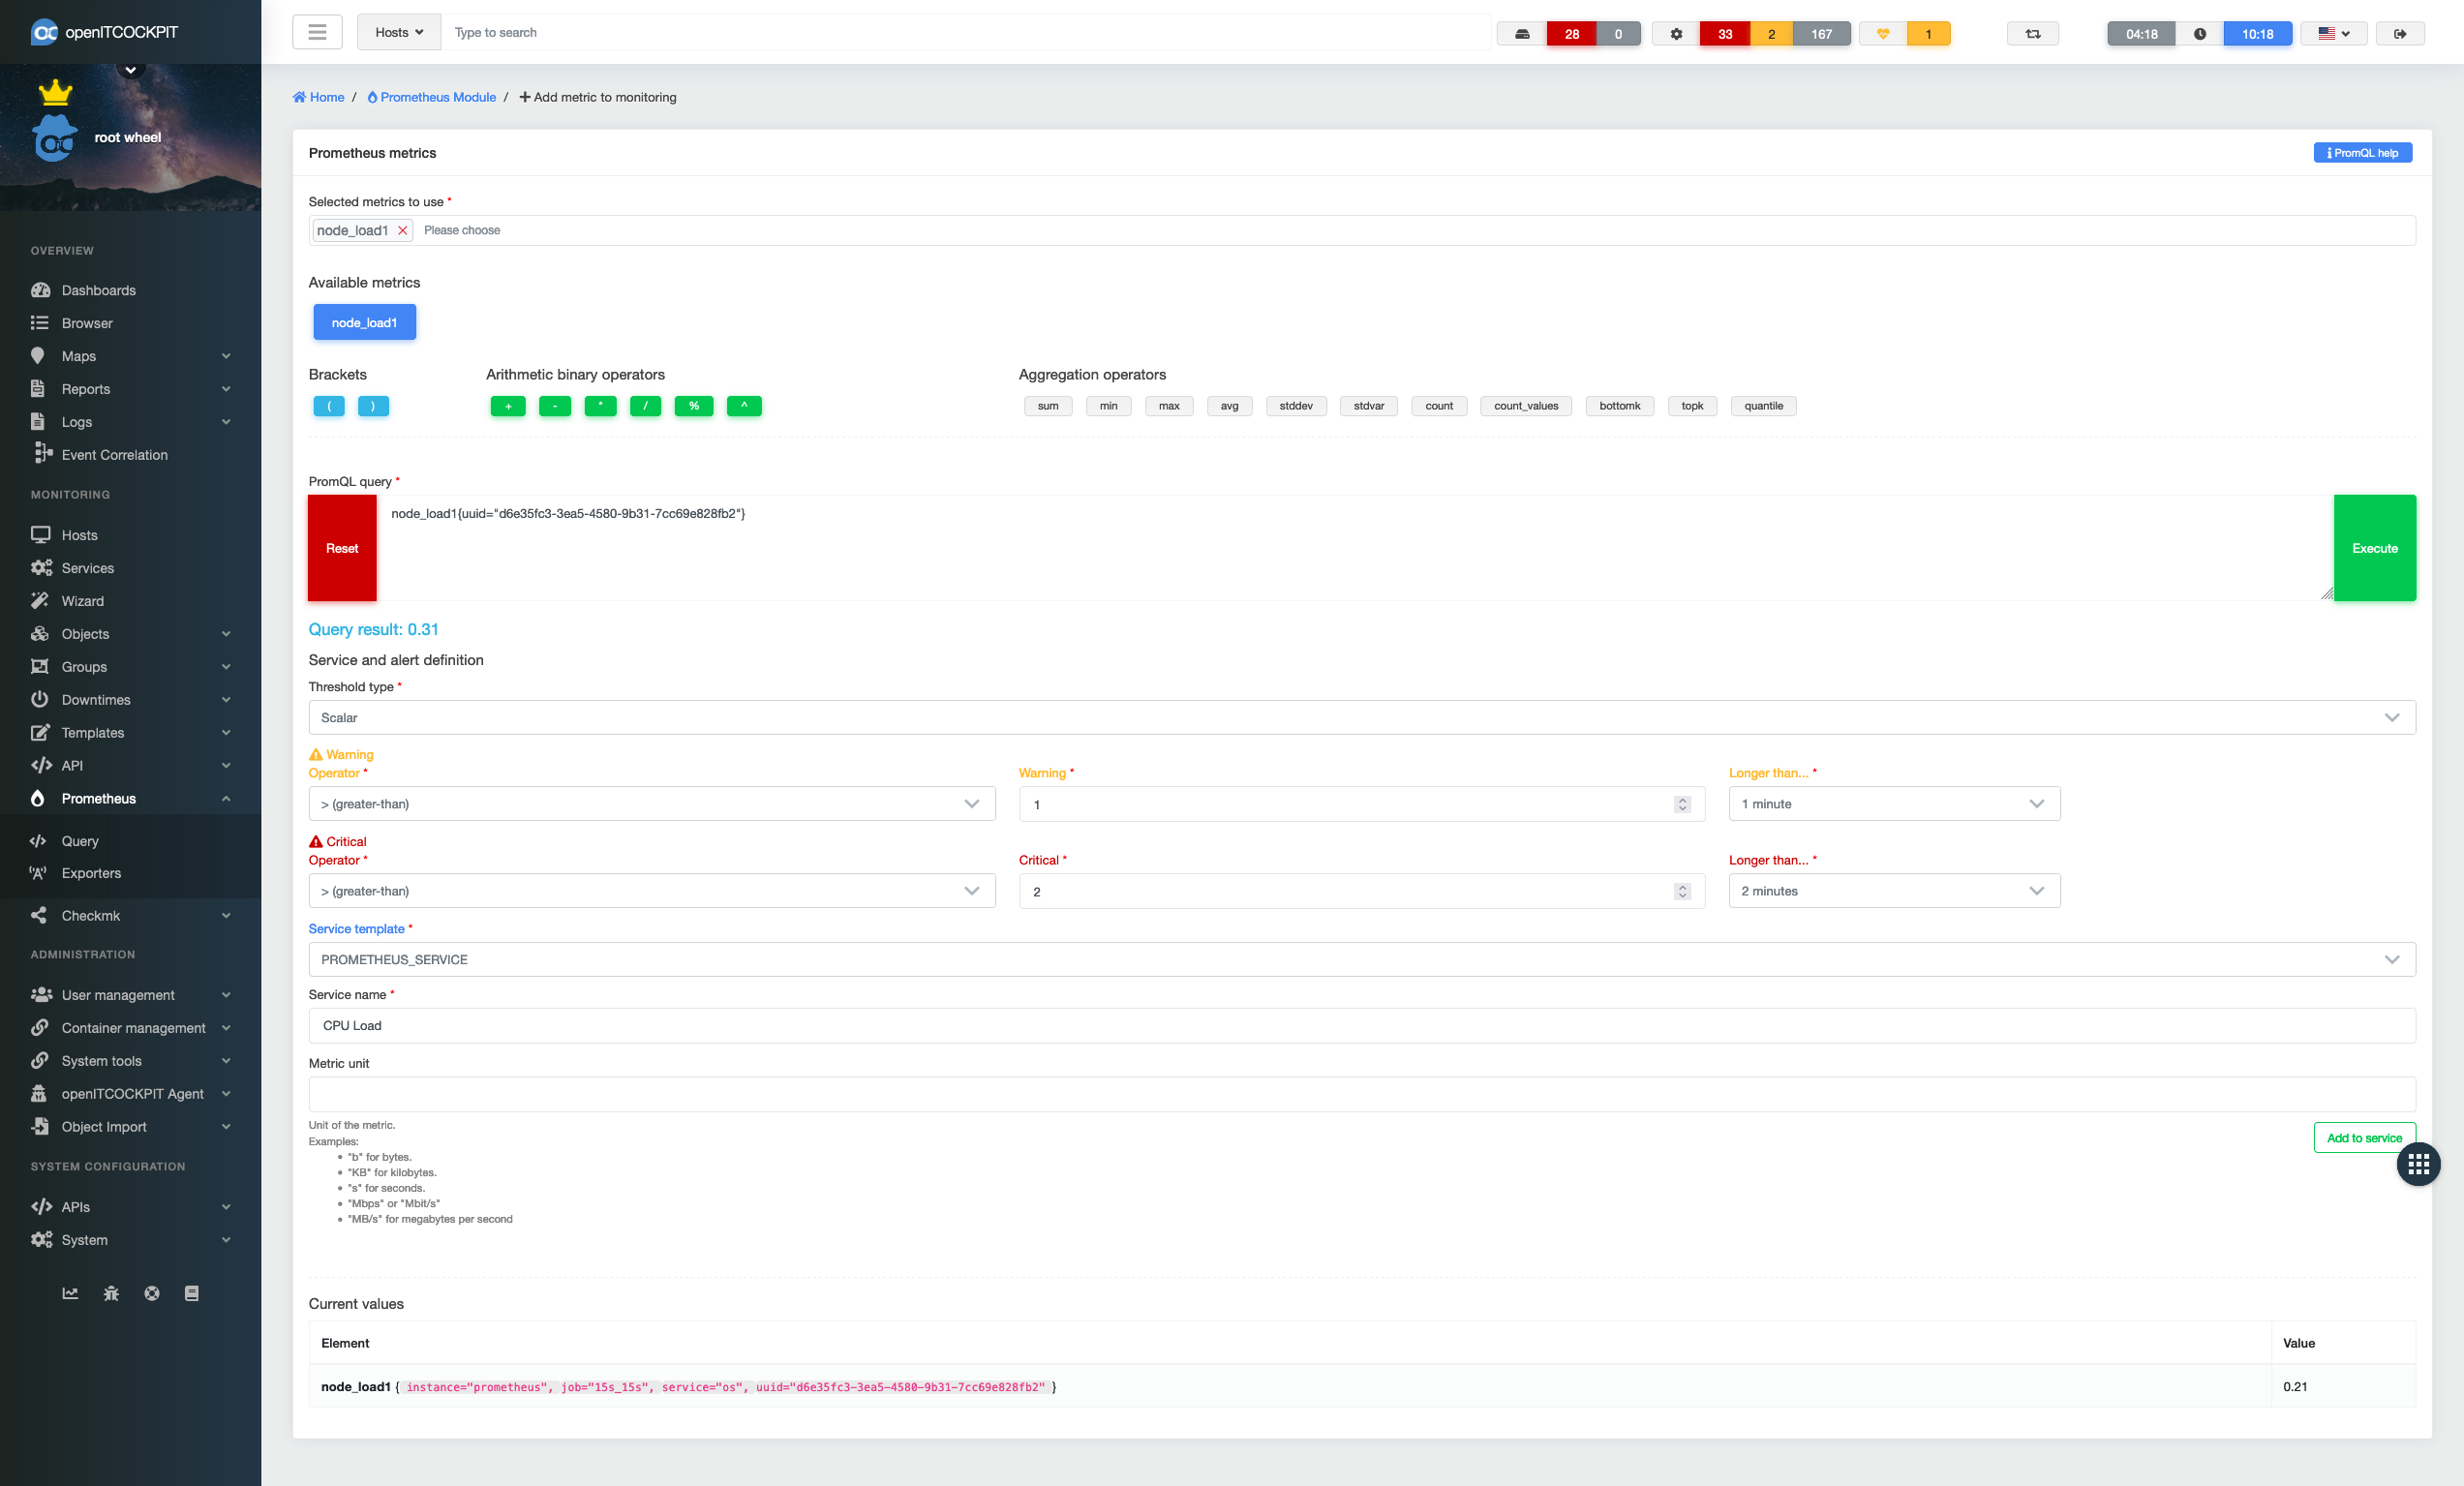
Prometheus also offers the ability to coordinate multiple metrics with each other. For example, you can query the memory usage under Linux:
node_memory_MemAvailable_bytes{uuid="d6e35fc3-3ea5-4580-9b31-7cc69e828fb2"} / node_memory_MemTotal_bytes{uuid="d6e35fc3-3ea5-4580-9b31-7cc69e828fb2"} * 100
Further examples can be found under "PromQL help" (top right) as a module. The UUID is always that of the current host, so you can simply copy and paste the examples.
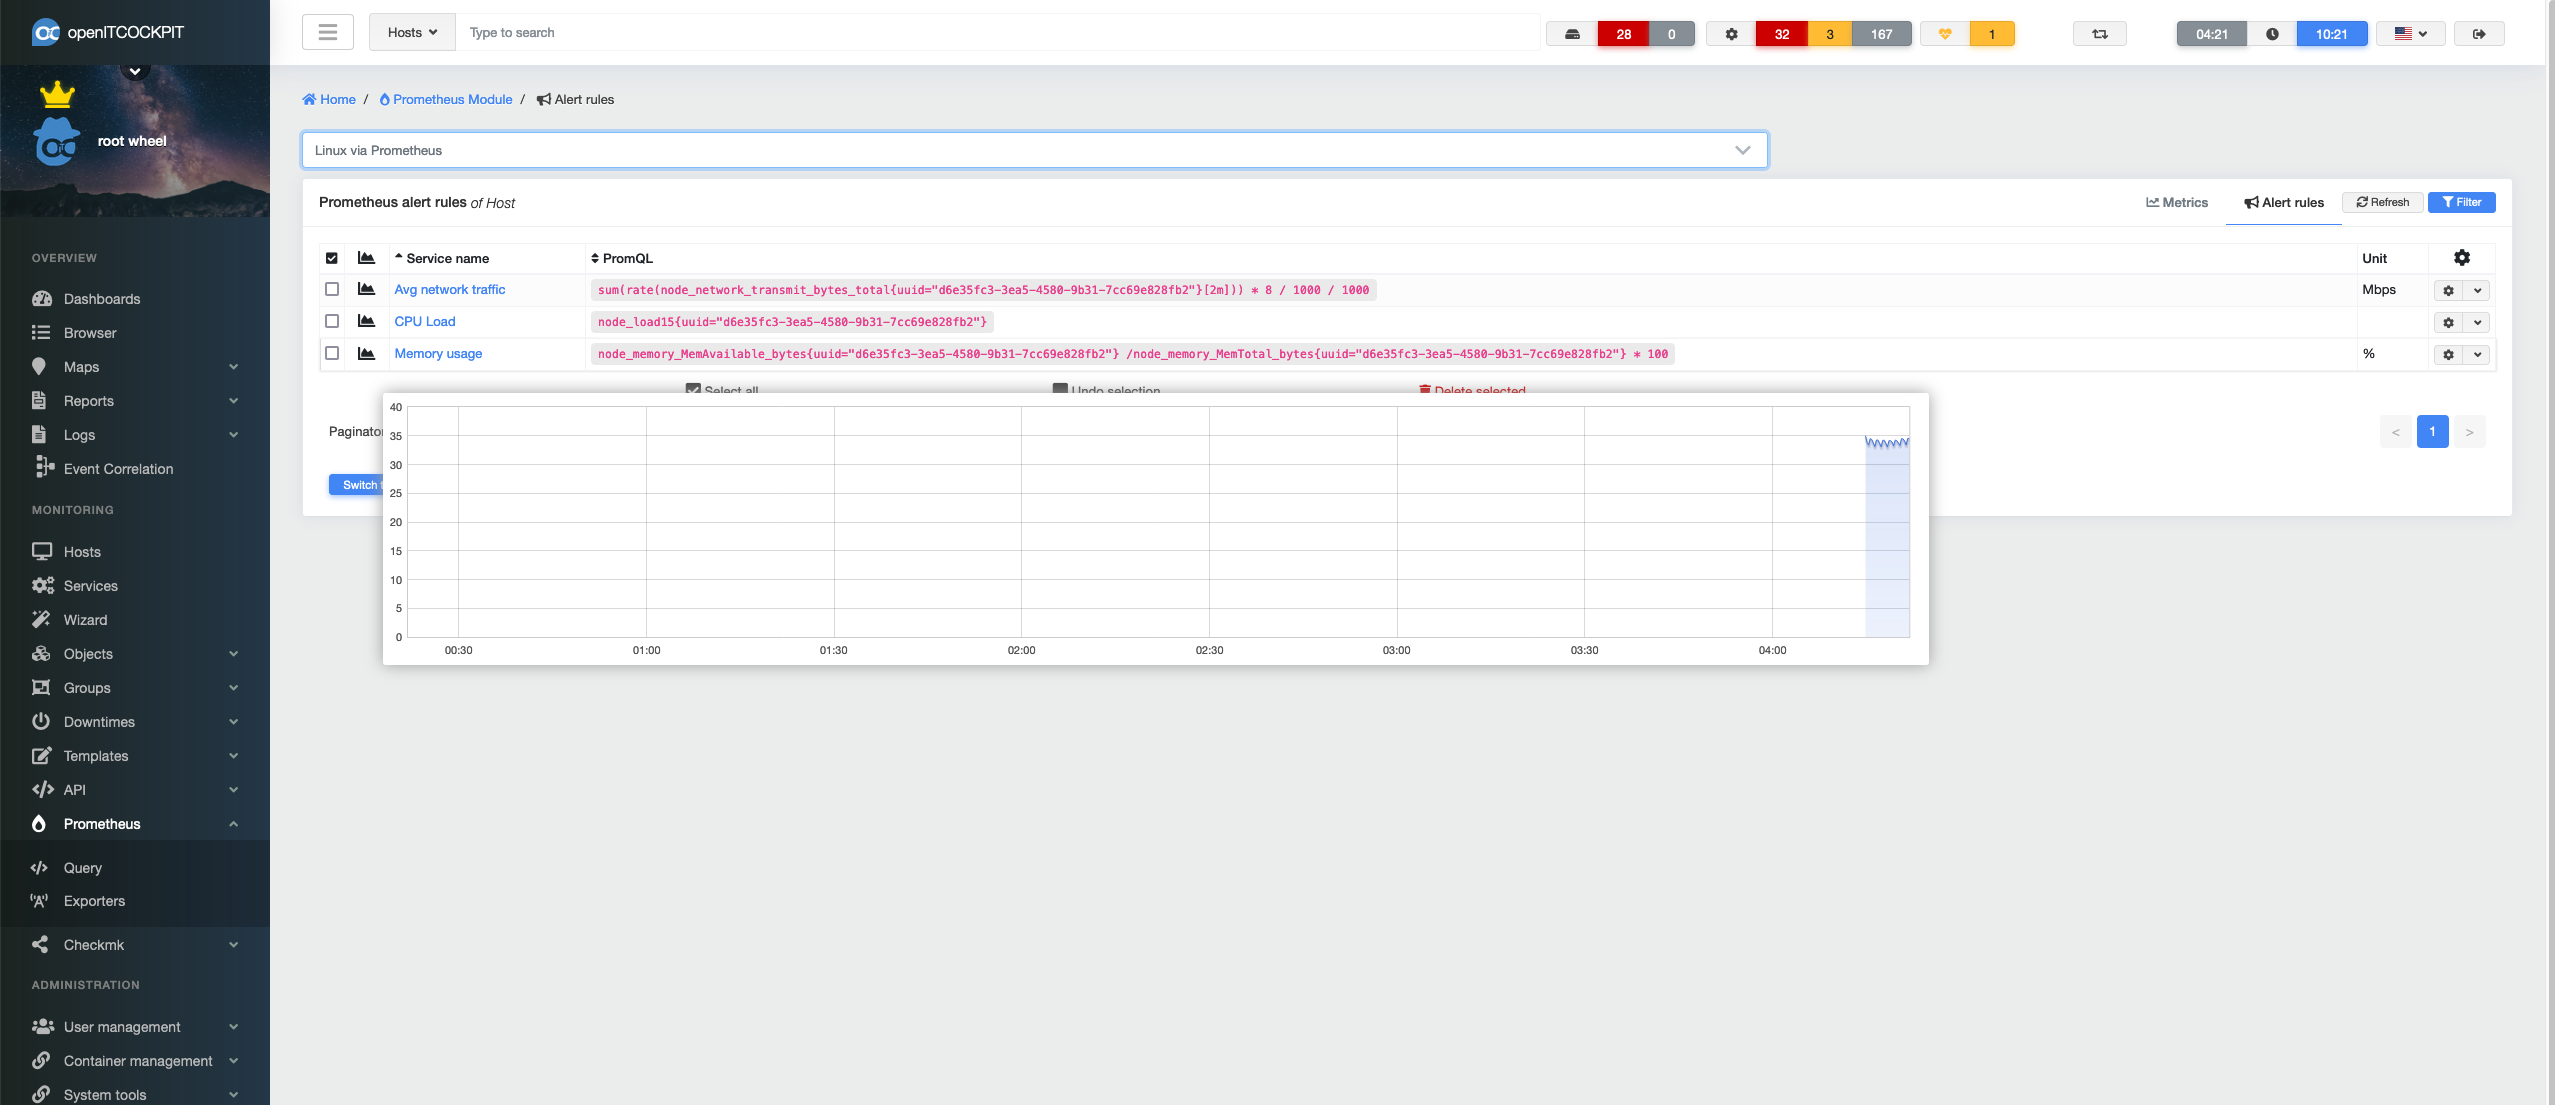
The individual Services can be found under Monitoring → Prometheus → Query → Alarm Rules. All queries are listed here by host. If you move the mouse over the graph, you will see the familiar oITC pop-over graph, which then sends the query to Prometheus and displays the current values:
On a host itself, however, it is no longer possible to see what a service is monitored by.
This is why we have introduced the service type. Prometheus services are also normal Nagios services. In the background, an openITCOCKPIT service systemctl status prometheus_bridge.service queries the status of Prometheus every 15 seconds and then passively passes it to Naemon. So, in summary: Prometheus does the monitoring, then Naemon sends out notifications so that we can continue to see events like downtimes and acknowledgements. This process also makes it possible to easily use Prometheus in EVCs, autoreports and a host of other uses.
Troubleshooting
The following services must be running for Prometheus to function:
systemctl status prometheus.service
systemctl status prometheus_bridge.service