Reporting
As you would expect, openITCOCKPIT includes a reporting function. These reports can contain a wide variety of data such as maintenance times, failures, downtimes and the current status of individual hosts and services.
Instant reports
Instant reports in openITCOCKPIT are a reporting function that can be generated as HTML or PDF files and optionally sent at a user-defined interval.
Instant reports also contain a summary of the status of hosts, services, host groups or service groups, depending on the options selected.
Generating an instant report
To generate an instant report, first click the “New” button in the “Instant Reports” overview.
Then select a container, assign a name and then select the object type to be evaluated.
Depending on the object type selected, you can then select either hosts, host groups, services or service groups you would like to report on.
The time range indicates the period of time over which the evaluation should take place.
The reflection state defines whether either both a hard and soft state or only a hard state should be taken into account.
You have the option to take maintenance times into account in your reporting by selecting the “Include downtimes” option.
If the option “Display summary ” is selected, instead of listing individual hosts and their services, only an overview of the status of the host and its services will be displayed.
If you want to automatically send a report every day, week, month or year, the “Send email” option must be activated.
Once this option has been enabled, you can send reports to one or more users.
| Field | Required | Description |
|---|---|---|
| Container | Container in which the immediate report is to be created | |
| Name | Name of the instant report | |
| Type | Object type to be evaluated. Host groups, hosts, service groups and services are possible | |
| Type-Object | Depending on the type selected, either hosts, host groups, services or service groups must be selected in the next field | |
| Evaluation | Which objects are evaluated -> Only hosts, hosts and services or only services | |
| Time period | Time period to consider | |
| Reflection State | The type of state to be evaluated. Hard state or soft and hard state | |
| Consider maintenance times | Determines whether maintenance times are to be taken into account | |
| Summary Display | Determines whether an overall view of the status of host and services is displayed instead of the listings of individual hosts. | |
| Send Email | ||
| Sending Interval | Sending interval: DAY, WEEK, MONTH, YEAR | |
| User(s) to send | User(s) to whom the report is to be sent |
Generate the Report
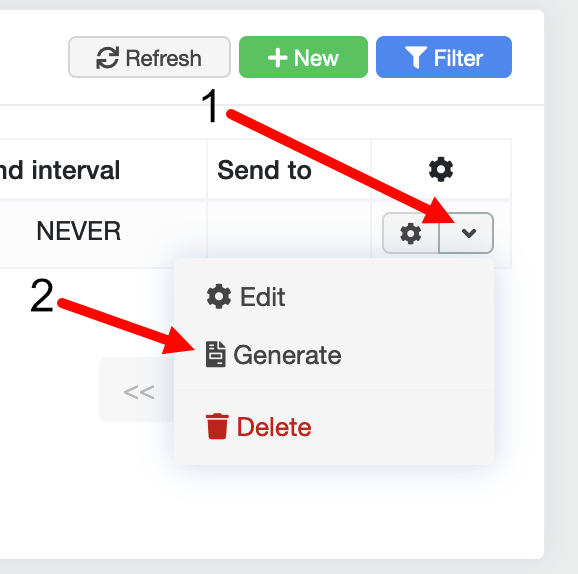
When you have created an “Instant Report”, click on the menu of the corresponding “Instant Report” (1) and then on the “Generate” button (2).
In the form that opens, choose the report format and the period you want the report to cover. The report will then be displayed in the browser or made available for download.
Current state report
The “Current State Report” generates a report in HTML or PDF format based on the services selected.
In addition to the status filter functions, you can also filter according to confirmations, maintenance times and the type of test used.
The generated report also contains the host status of the selected services as well as the various metrics (performance data) of the services.
| Field | Required | Description |
|---|---|---|
| Services | Services that are to be evaluated | |
| Report format | Report or Format HTML or PDF |
Downtime reports
Downtime reports in openITCOCKPIT provide information about which hosts or which hosts and services were undergoing maintenance and when. This is displayed visually using a calendar and diagrams system.
Creating a downtime report
To create a downtime report, click on “Downtime reports” in the main menu.
There you can select whether only hosts or hosts and services should be evaluated.
You can choose from two report formats: an HTML report that is displayed in the browser or a PDF report that can be downloaded.
The period defines which downtimes should be taken into account.
The reflection state defines whether either both a soft and hard state or only a hard state should be taken into account.
| Field | Required | Description |
|---|---|---|
| Evaluation | Hosts or hosts including services | |
| Report Format | Report format HTML or PDF | |
| Time Period | Time period to consider | |
| From | Start period of evaluation | |
| To | End period of evaluation | |
| Reflection State | The type of state to be evaluated. Hard state or soft and hard state | |
| Dynamic Colour | If there is an error, different colours are shown |
Status pages
Status pages in openITCOCKPIT provide informations about hosts, services, hostgroups, servicegroups in a unified way.
Statuspages can have a public route, so that they are accesible without login. For public reasons you can anonymize all status page elements with alias names. The elements of the status-page will all shown in the same way, so you cannot recognize which type of Element it is.
Status page elements can have additional informations about acknowledgements, downtimes or planned downtimes and you can con wheter this informations should provided on the status page or not.
Creating
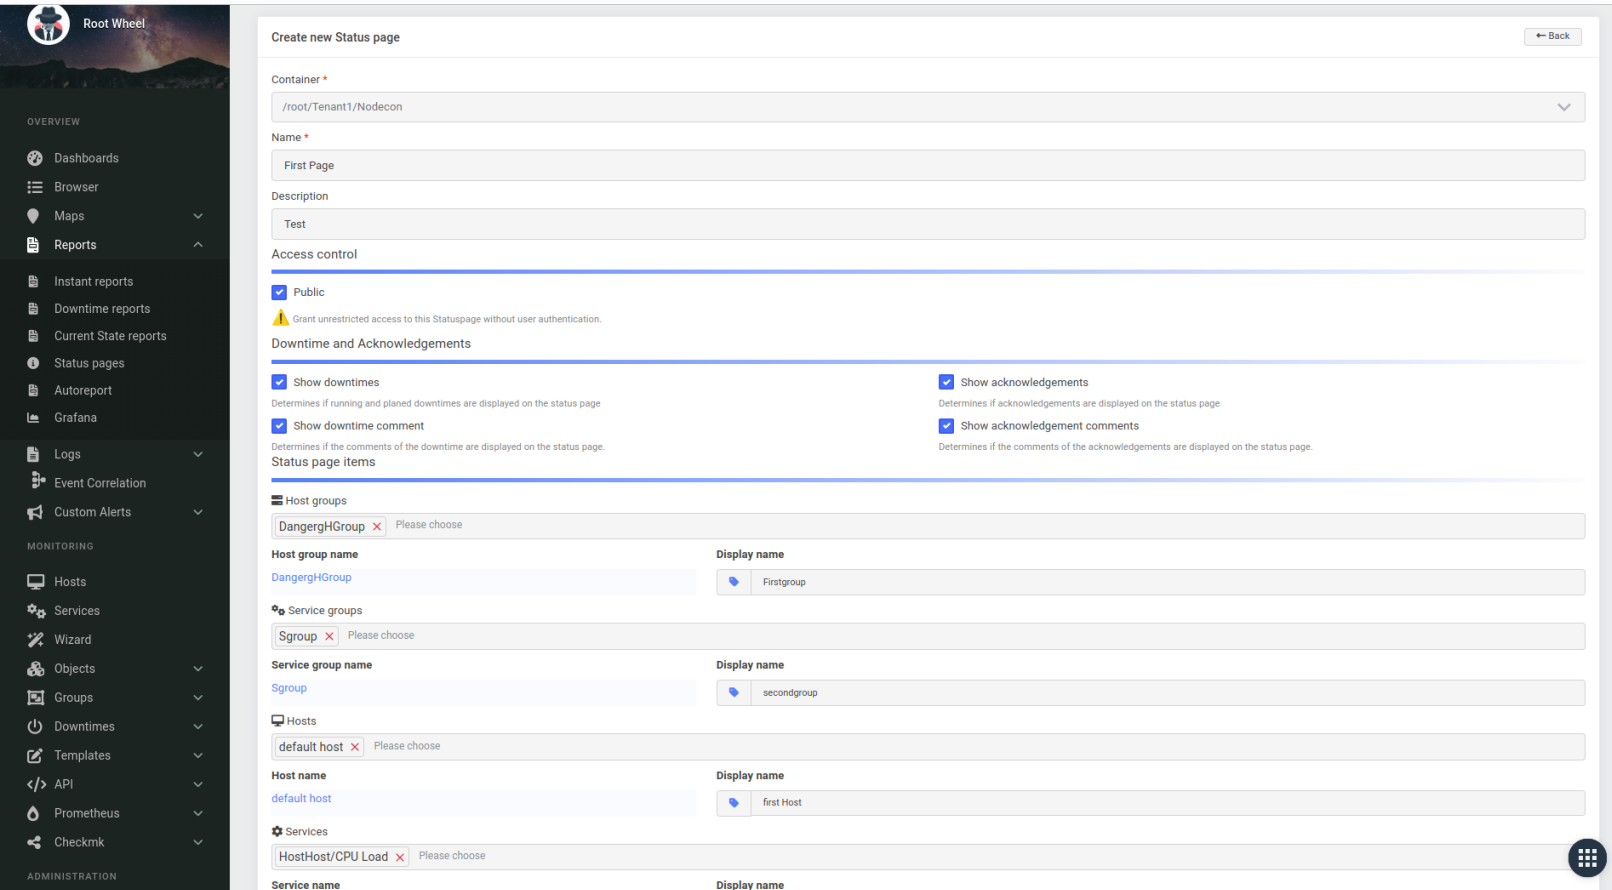
| Field | Required | Description |
|---|---|---|
| Container | The container determines the element selection,elements of the root container are always selectable | |
| Name | The name of the page | |
| Description | Optional page description | |
| Public | if marked the page is public - without autentication accessible | |
| Show Downtimes | if marked all current/planned downimes with their values will be dispayed at the element | |
| Show downtime comments | if marked, the origin comment is displayed otherwise a anonymemous generic comment | |
| Show acknowlegements | if marked, it is displayed how many of the problems ar acknowledged | |
| Acknowlegements comments | if marked, theo rigin comment swill be displayed, otherwise ageneric comment | |
| Host groups, Service groups, Hosts, Services | the selectable elements of the status page | |
| Display name | an optional alias name of the elkement, if given the alias will be displayed, otherwise the original name |
View
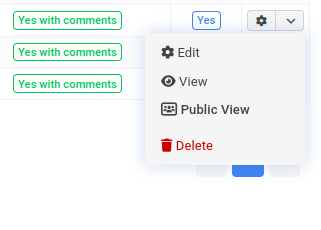
Internal View
External view
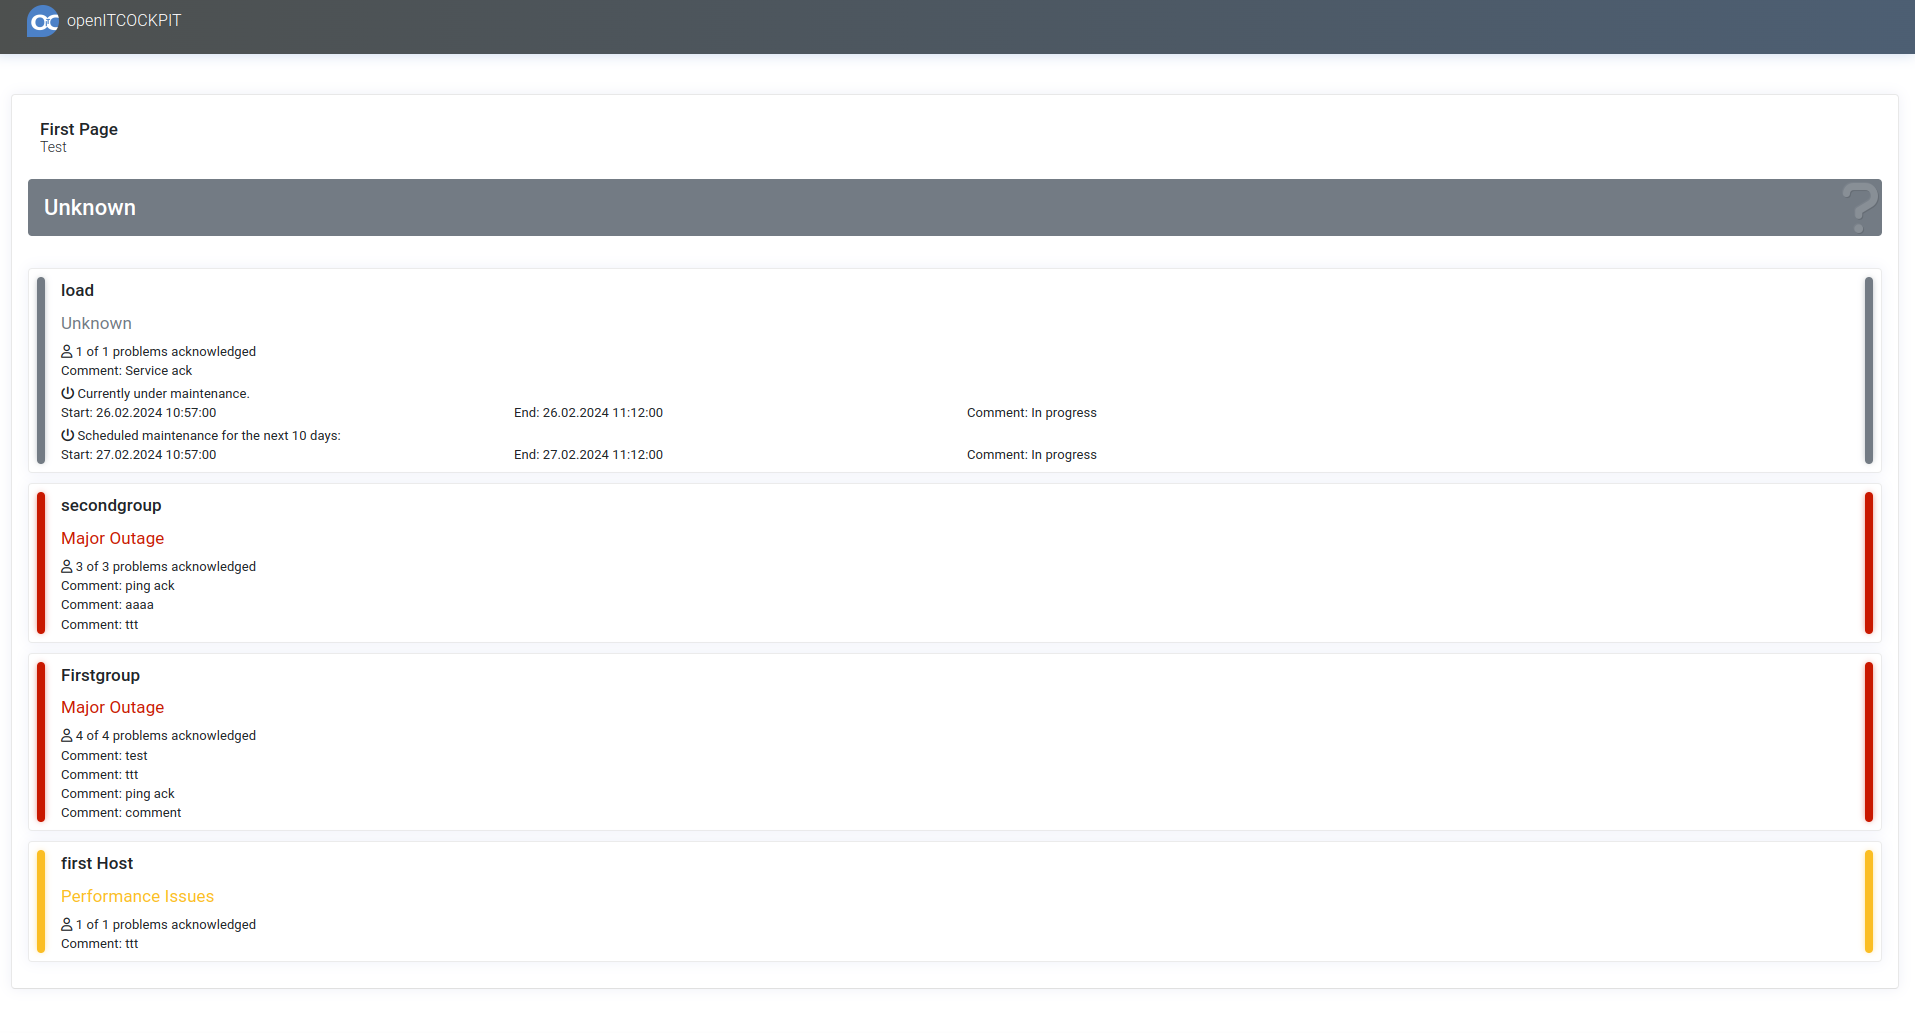
In- / external View are generally the same, but in internal view the element names are links to the elements.
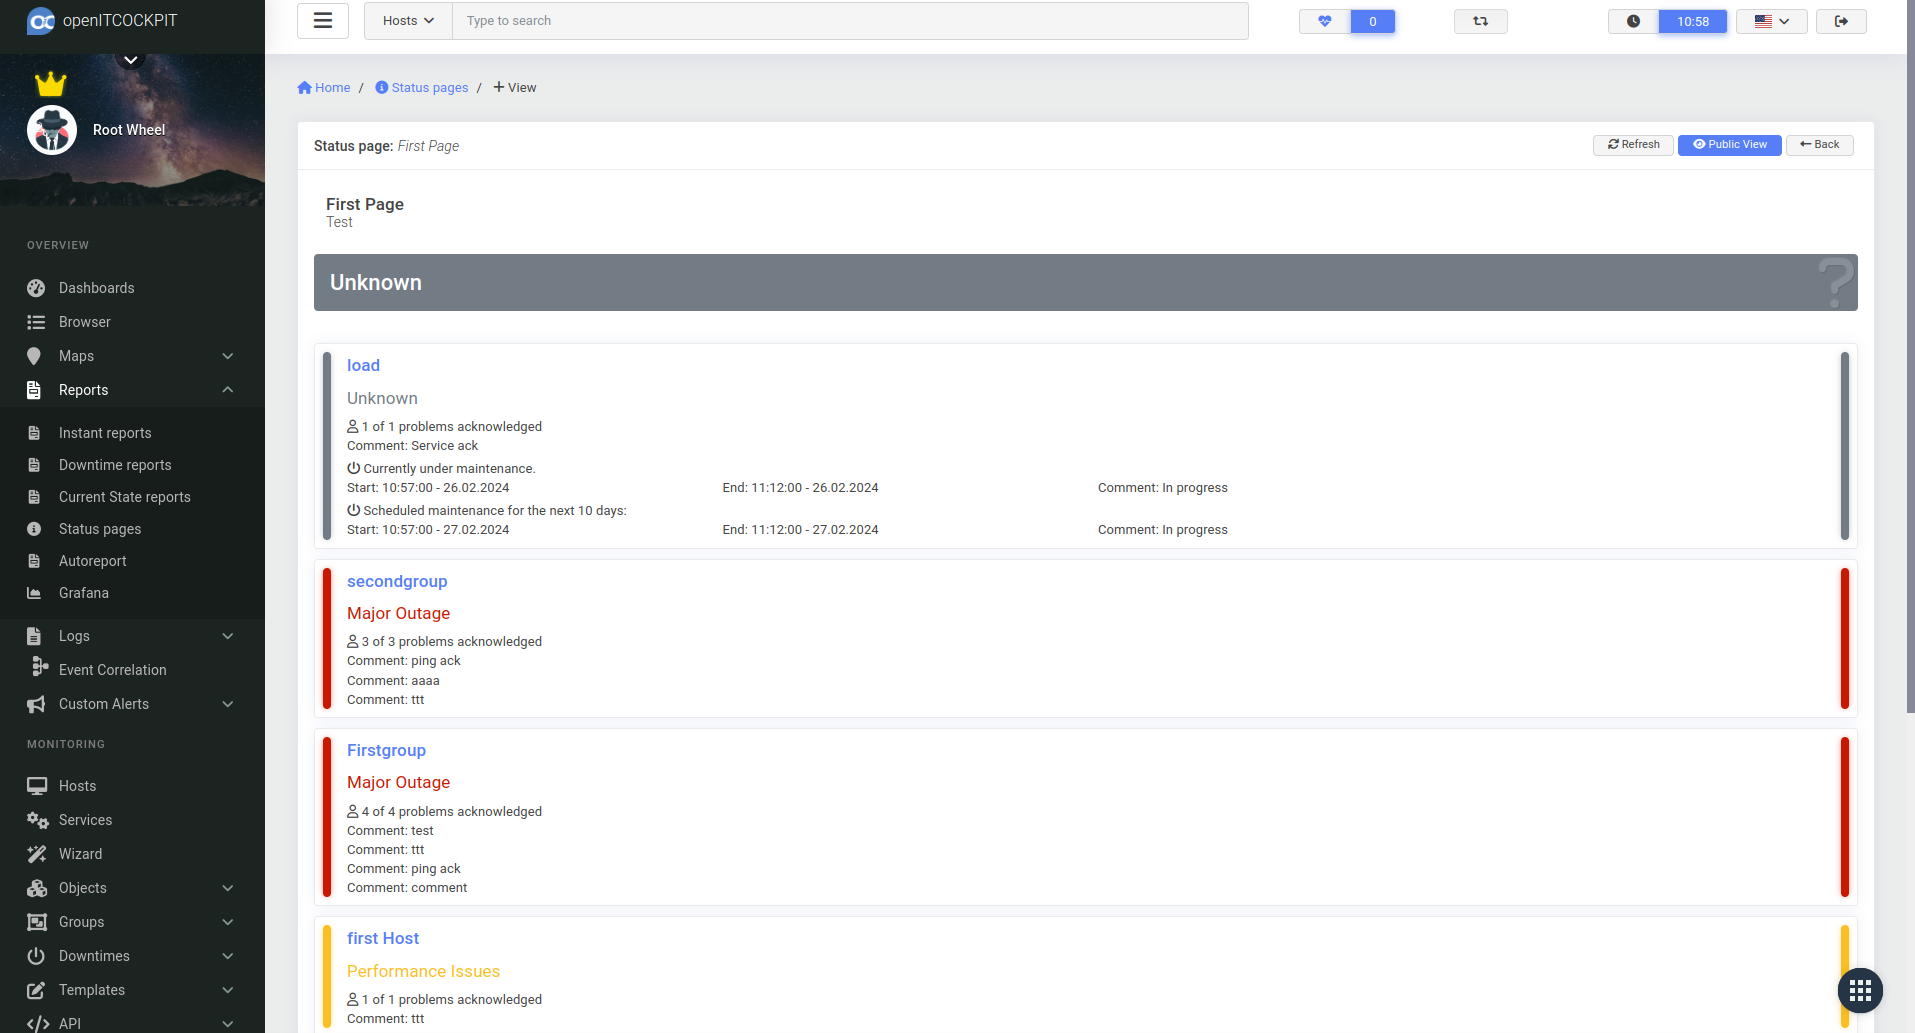
State, Color
the color of the elements are the general openITCOCKPIT state colors. The color will be calculated dependend of the element type.
Available states
- Purple: Not in Monitoring
- Green: Operational
- Yellow: Performance Issues
- Red: Major Outage
- Gray: Unknown
| Type | State/Color | |
|---|---|---|
| Service | The state(color) ist the state of the service | |
| Service group | The state is the cumulated worst state of all included services | . |
| Host | Is the state of the host in Down, Unreachable than this is the state(color) of The element. If the host is UP, the worst state of the included services of the host will be evaluated to the state of the host element. so the color(state) of a host element in a status page can be yellow in case the host is UP(green) but the worst state of the underlying services is WARNING(yellow) | |
| Host group | If the worst state of all inherited hosts is other than UP, then this is te state of the host group element. Otherwise the state wiil be cumulated over all services of all hosts. | |
| Status page | The state of the page is the worst state of all page elements |
Counting of problems/acknowledgements/downtimes
The counting of problems/downtimes correspndents to the calculating of the state dependend on the element type.
| Type | problems(acknowledgements)/downtimes (current, planned) |
|---|---|
| Service | If the services is other than OK, it will be counted whether the service ist acknowlwdged. Current downtime and all palnned downtimes of the next 10 days will be counted and displayed |
| Service group | The problems of all services and how many of them are acknowledged will be counted. The downtimes (planned downtimes) of all services will be counted and displayed |
| Host | All problems of the host and the included services will be counted. It will be displayed how many of them are acknowleged. Alle downtimes (current, planned) of the host and the inhertited servies will be counted and displayed |
| Host group | all problems/acknowledgemnts over all hosts and included services will be counted. All downtimes(current, planned) of all hosts and included services will be counted and displayed |
Status page groups
The Status Page Groups feature allows you to organize multiple status pages into a 2-dimensional matrix, providing a clear and high-level overview.
Each Status Page Group consists of multiple Collections and Categories.
Let's assume you want to present the status of different data centers in a status page group. First of all you should create status pages for each data center.
In the next step you can define collections such as Fulda, Frankfurt and Berlin to represent data center locations.
Next, you add categories like Facility, Infrastructure and Services. Each cell in the matrix can contain one or more status pages, giving you a comprehensive view
of the status for each location and category.
The given example would result in a Status Page Group matrix like this
| Facility | Infrastructure | Services | |
|---|---|---|---|
| Fulda | [Status Page/s] | [Status Page/s] | [Status Page/s] |
| Frankfurt | [Status Page/s] | [Status Page/s] | [Status Page/s] |
| Berlin | [Status Page/s] | [Status Page/s] | [Status Page/s] |
Optionally, you can add custom text to the Status Page Group. This allows you to include useful information such as phone numbers, links to a wiki, or other relevant details.
Creating
The creation of new Status Page Groups is separated into two steps. In the first step, you need to define the status page matrix.
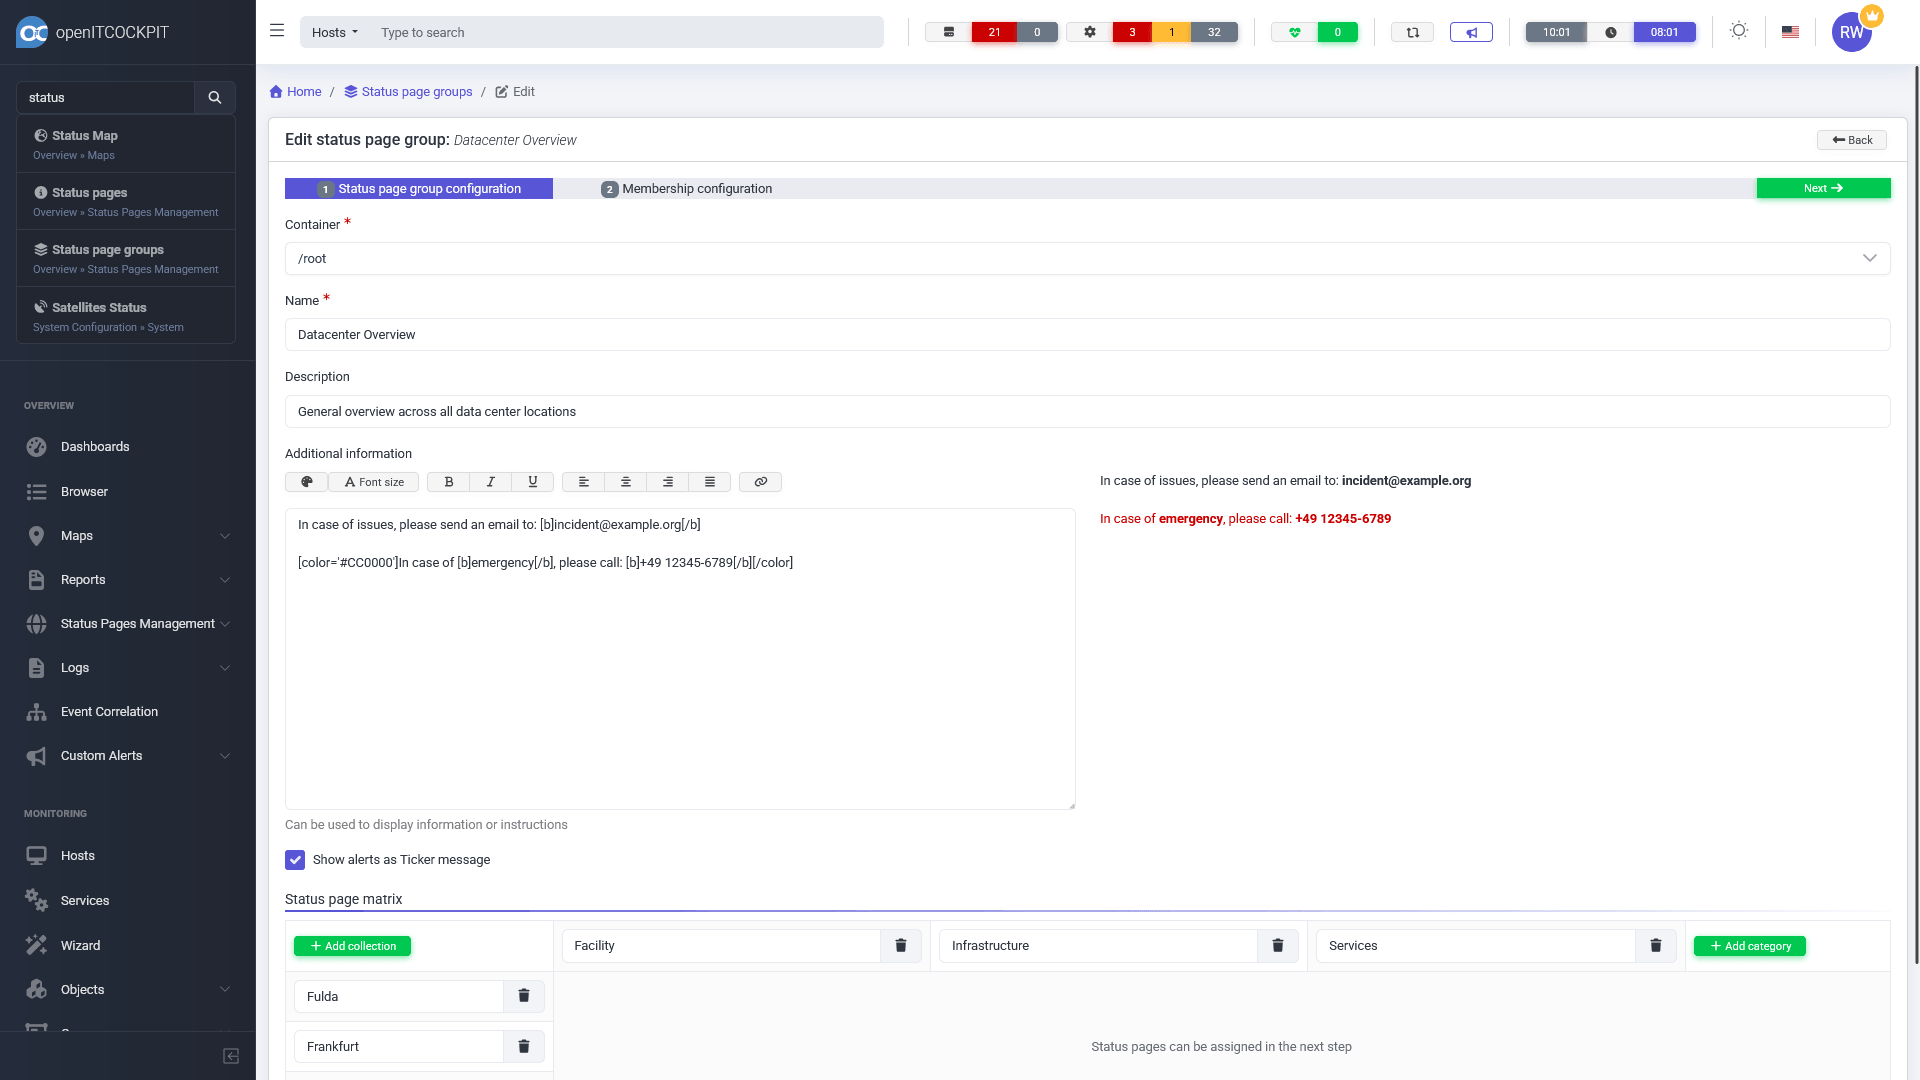
| Field | Required | Description |
|---|---|---|
| Container | The container determines the element selection,elements of the root container aere always selectable | |
| Name | The name of the Status Page Group | |
| Description | Optional description | |
| Additional information | Optional free text field to store relevant information such as phone numbers. | |
| Show alerts as Ticker message | Determins if alerts will be displayed as scrolling text (marquee) | |
| Collection | First dimension of the matrix (Y axis) | |
| Category | Second dimension of the matrix (X axis) |
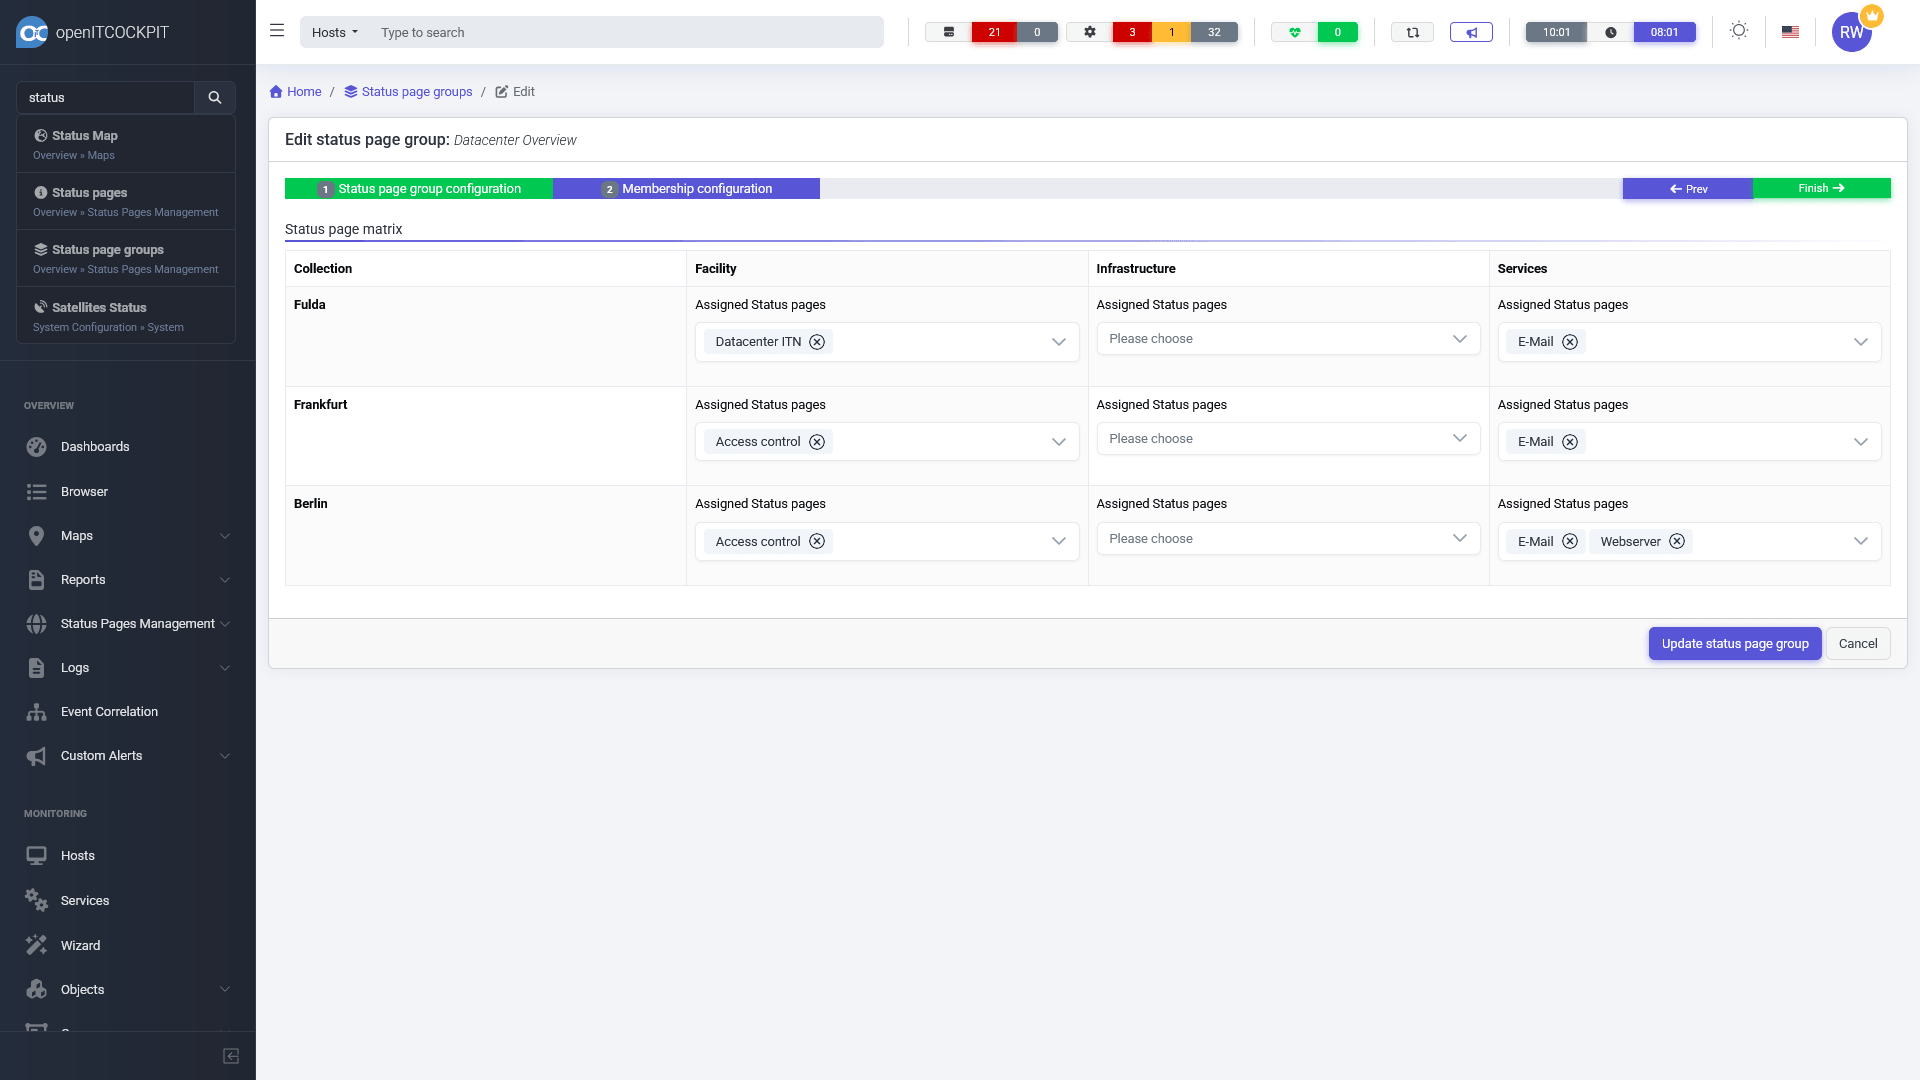
In the second step, you can assign status pages. Each cell can contain multiple status pages, or no status page.
openITCOCKPIT calculates the status of each cell in a Status Page Group by evaluating all assigned status pages and determining the worst state—this is known as the "worst state wins" principle.
- Cell Status: Each cell can contain multiple status pages. The cell's status is set to the worst state found among all its status pages.
- Collection Status (Row): The status for a collection (row) is calculated by cumulating the states of all cells in that row. Again, the worst state determines the overall status for the collection.
- Category Status (Column): The status for a category (column) is calculated by cumulating the states of all cells in that column. The worst state in the column will be shown as the category status.
This approach ensures that any critical issue within a group is immediately visible at the collection or category level, making it easy to identify and respond to problems.
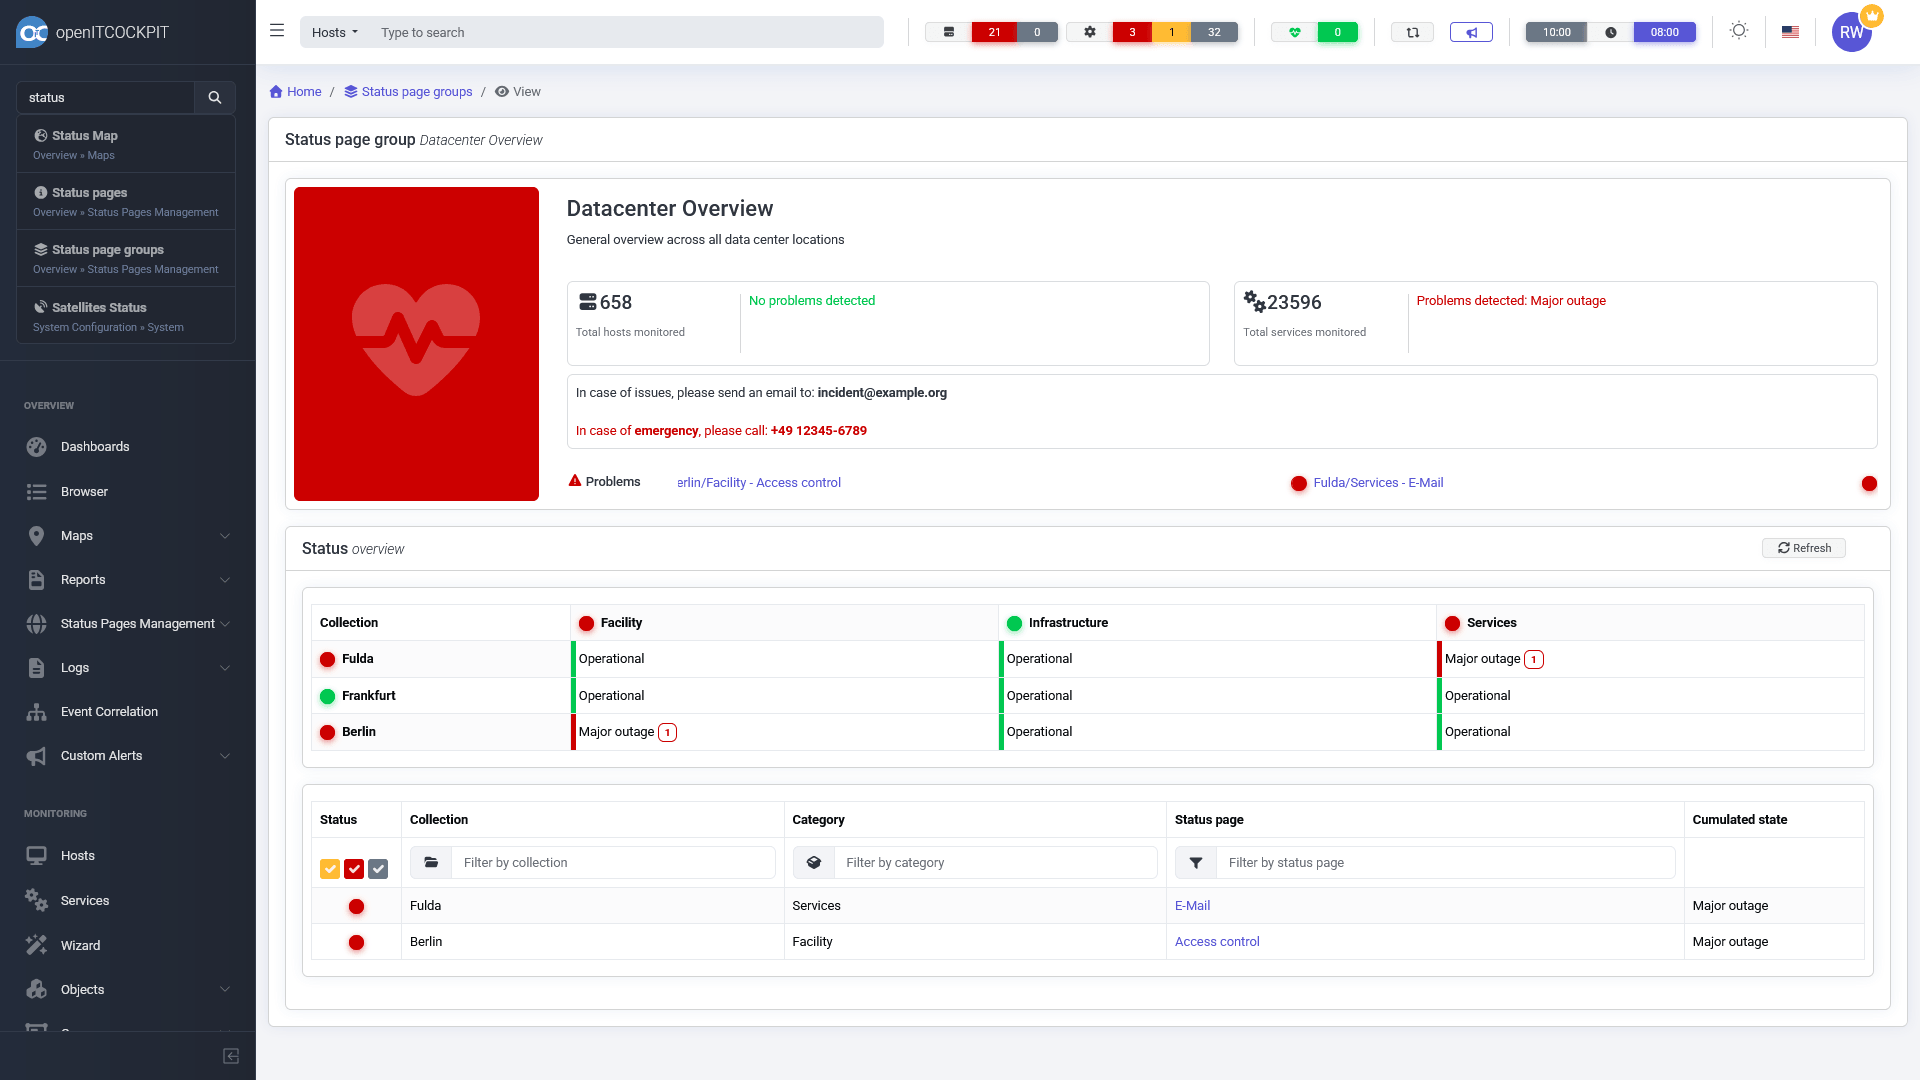
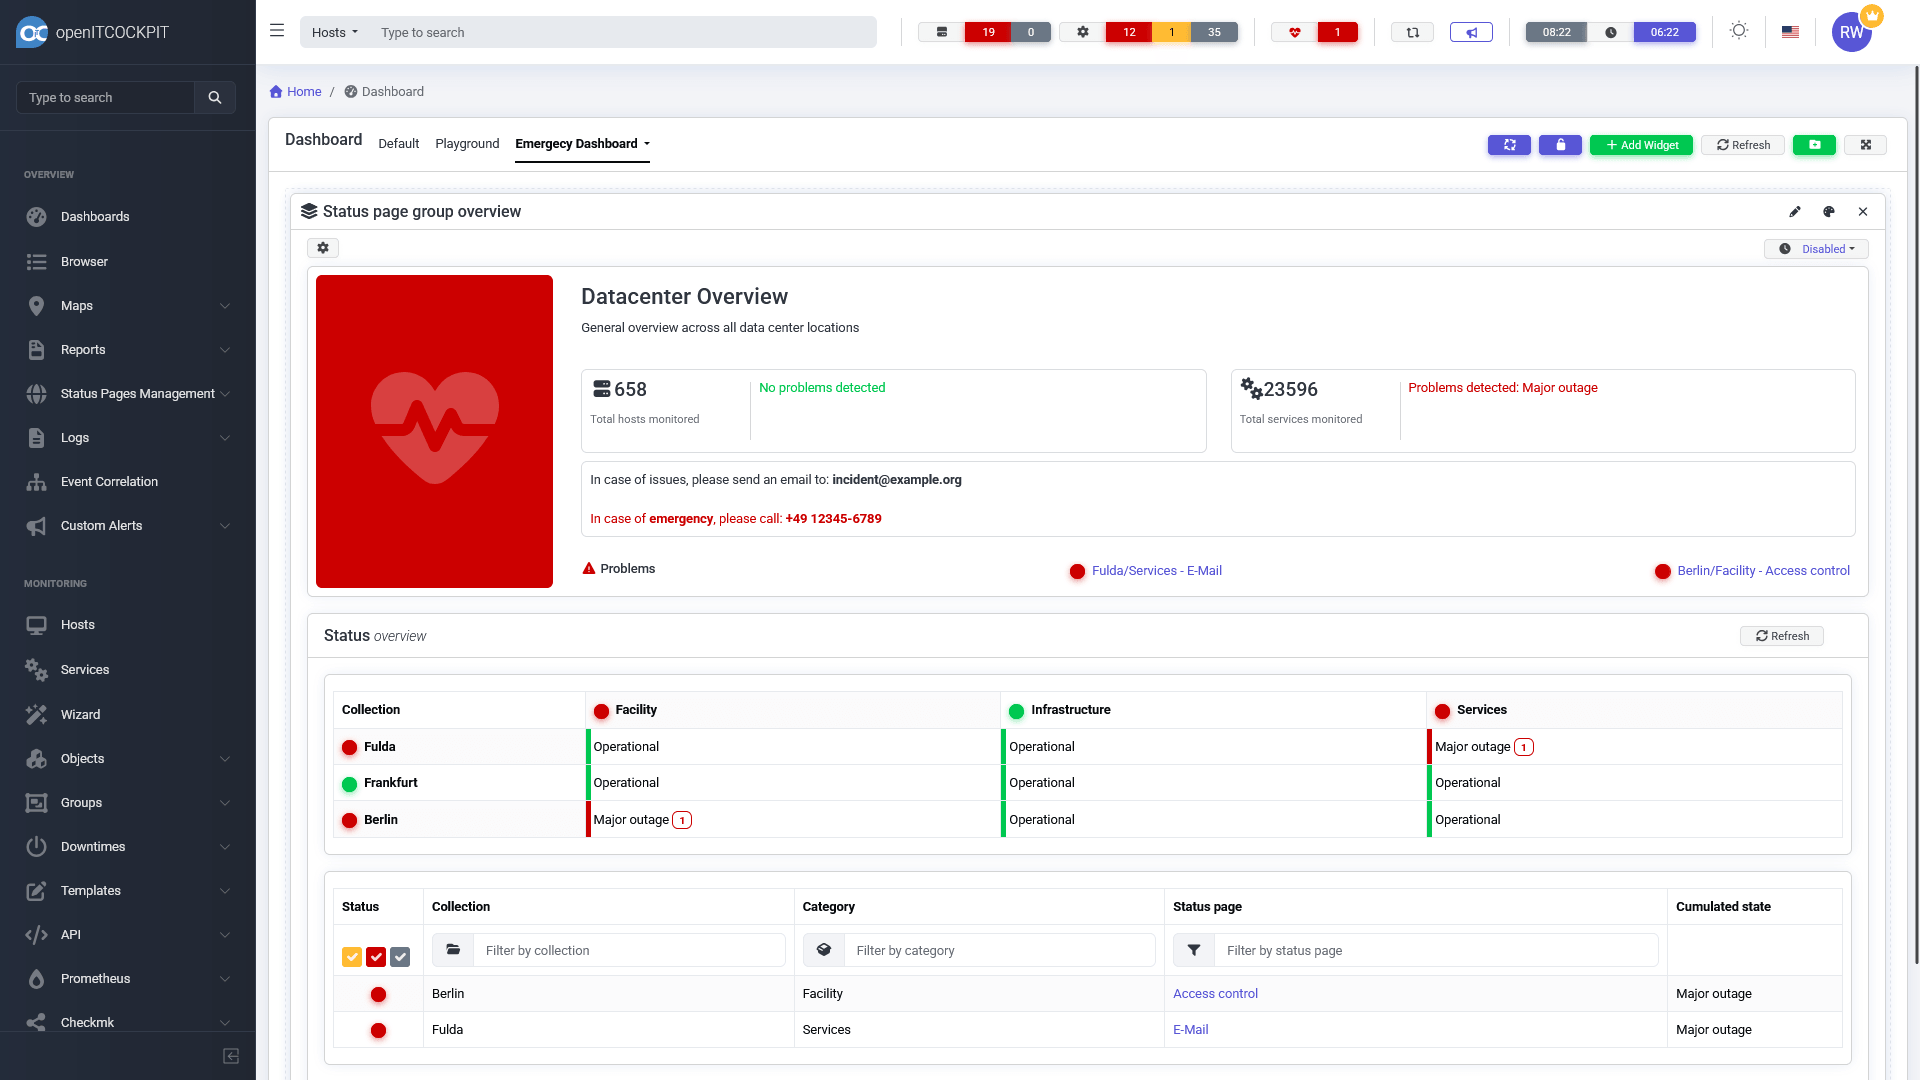
View
The view of a Status Page Group starts with the name of the group, followed by an optional description.
At the top, a large icon visually represents the overall state of the Status Page Group. The state is calculated by cumulating the states of all assigned status pages—using the "worst state wins" principle.
Available states
- Purple: Not in Monitoring
- Green: Operational
- Yellow: Performance Issues
- Red: Major Outage
- Gray: Unknown
Next to the icon, you will see a counter displaying the total number of hosts and services represented by the Status Page Group.
Below this, an optional free text field can be shown. This area can be used to display useful information such as phone numbers, email addresses, or other relevant details.
All current problems are listed as scrolling marquee text, making critical issues immediately visible.
Status Overview
The "Status Overview" section displays the 2-dimensional matrix of all collections (rows) and categories (columns). Each cell shows the status of the assigned status pages, making it easy to get a high-level overview of your infrastructure.
Problems Table
Below the matrix, a table lists all problems (if any) in detail, so you can quickly identify and address issues.
Dashboard
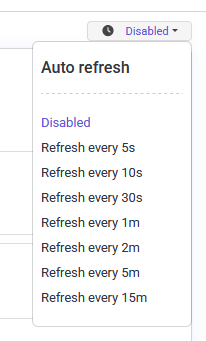
Status Page Groups can also be added to a user's Dashboard for quick access and monitoring.

The widget displays the same information as the default view of Status Page Groups, including the overall state, host and service counters, custom information, and the status overview matrix.
You can configure an auto-refresh interval for the widget to ensure the displayed data is always up to date.
Autoreports CE
The autoreport module in openITCOCKPIT is a configurable report that can be sent out automatically. Reports contain the length of downtime, the maximum permissible downtime and the availability of the hosts and services that have been selected.
Creating an autoreport
To create an autoreport, first click on the “New” button in the autoreports overview.
The autoreport Wizard opens and will guide you through the steps for creating a report.
First select a container for the report and then assign a name to it.
Then select a period to use for the evaluation.
The evaluation period defines when the evaluation should begin.
The send interval defines how often the report should be sent.
You can then enter either the guaranteed availability (as a percentage) or the maximum number of outages you're willing to accept.
The graphs displayed can be given either in percent or hours. This is defined by making the appropriate selection in the “Graph” field.
The reflection state defines whether either both a soft and hard state or only a hard state should be taken into account.
So that maintenance times are not displayed as downtimes in the report, you can activate the “Consider downtimes” option.
To account for public holidays, you will need to activate the option “View public holidays” and then select a calendar.
At least one user must also be selected so that the report can be sent out.
Now select the hosts to be evaluated in the report.
An overview of the services for all the selected hosts will appear. Here you can choose how the selected items should be evaluated.
In the last step you will see an overview of the settings you have configured for the report. If you are satisfied with all your selections, click "Done" and the configuration will be complete.
The report will now automatically be sent at the specified time. However, you also have the option of generating the report directly as a PDF or HTML file. To do this, click on the “Generate report” option in the menu for the corresponding report.
From here you can select the output format and the time range to be evaluated. After clicking on “Generate report” you will either be offered the option to download the report as a PDF file or have it displayed directly in the browser as an HTML file.
Report configuration
| Field | Required | Description |
|---|---|---|
| Container | Container in which the Autoreport is to be created | |
| Report name | Name of the Autoreport | |
| Report description | Description of the Autoreport | |
| Set Start | Start date of the report is to be defined | |
| Start date | Start date of the report. Can only be edited if "Set Start" has been activated. | |
| Time period | Time period to consider | |
| Evaluation Period | Day, Week, Month, Quarter or Year | |
| Transmission interval | Daily, Weekly, Monthly, Quarterly, Yearly or Never | |
| Guaranteed availability | Availability in percent. Either "Guaranteed availability" or "Maximum number of failures" must be specified | |
| Maximum number of outages | Maximum number of outages. Either "Guaranteed availability" or "Maximum number of outages" must be specified | |
| Graph | Graph in percent or hours | |
| Reflection State | The type of state to be evaluated. Hard state or soft and hard state | |
| Consider maintenance times | Maintenance times do not count as outages if enabled | |
| Consider public holidays | Public holidays are considered | |
| Calendar | Calendar with public holidays. Only configurable if "Consider Holidays" is enabled. | |
| User(s) | User(s) to whom the report is to be sent |
Host and Service Configuration
| Field | Required | Description |
|---|---|---|
| Hosts | Hosts that are to be evaluated | |
| Service RegEx | Filter for services as regular expression |
Autoreport global settings
Various standard settings for the autoreports can be set in the main menu under System configuration → System → Autoreport global settings. Descriptions of the individual options can be found directly in the table under the “Info" button.

Please note that the options you select will affect all reports generated by the autoreport module!