User Interface
The interface at a glance
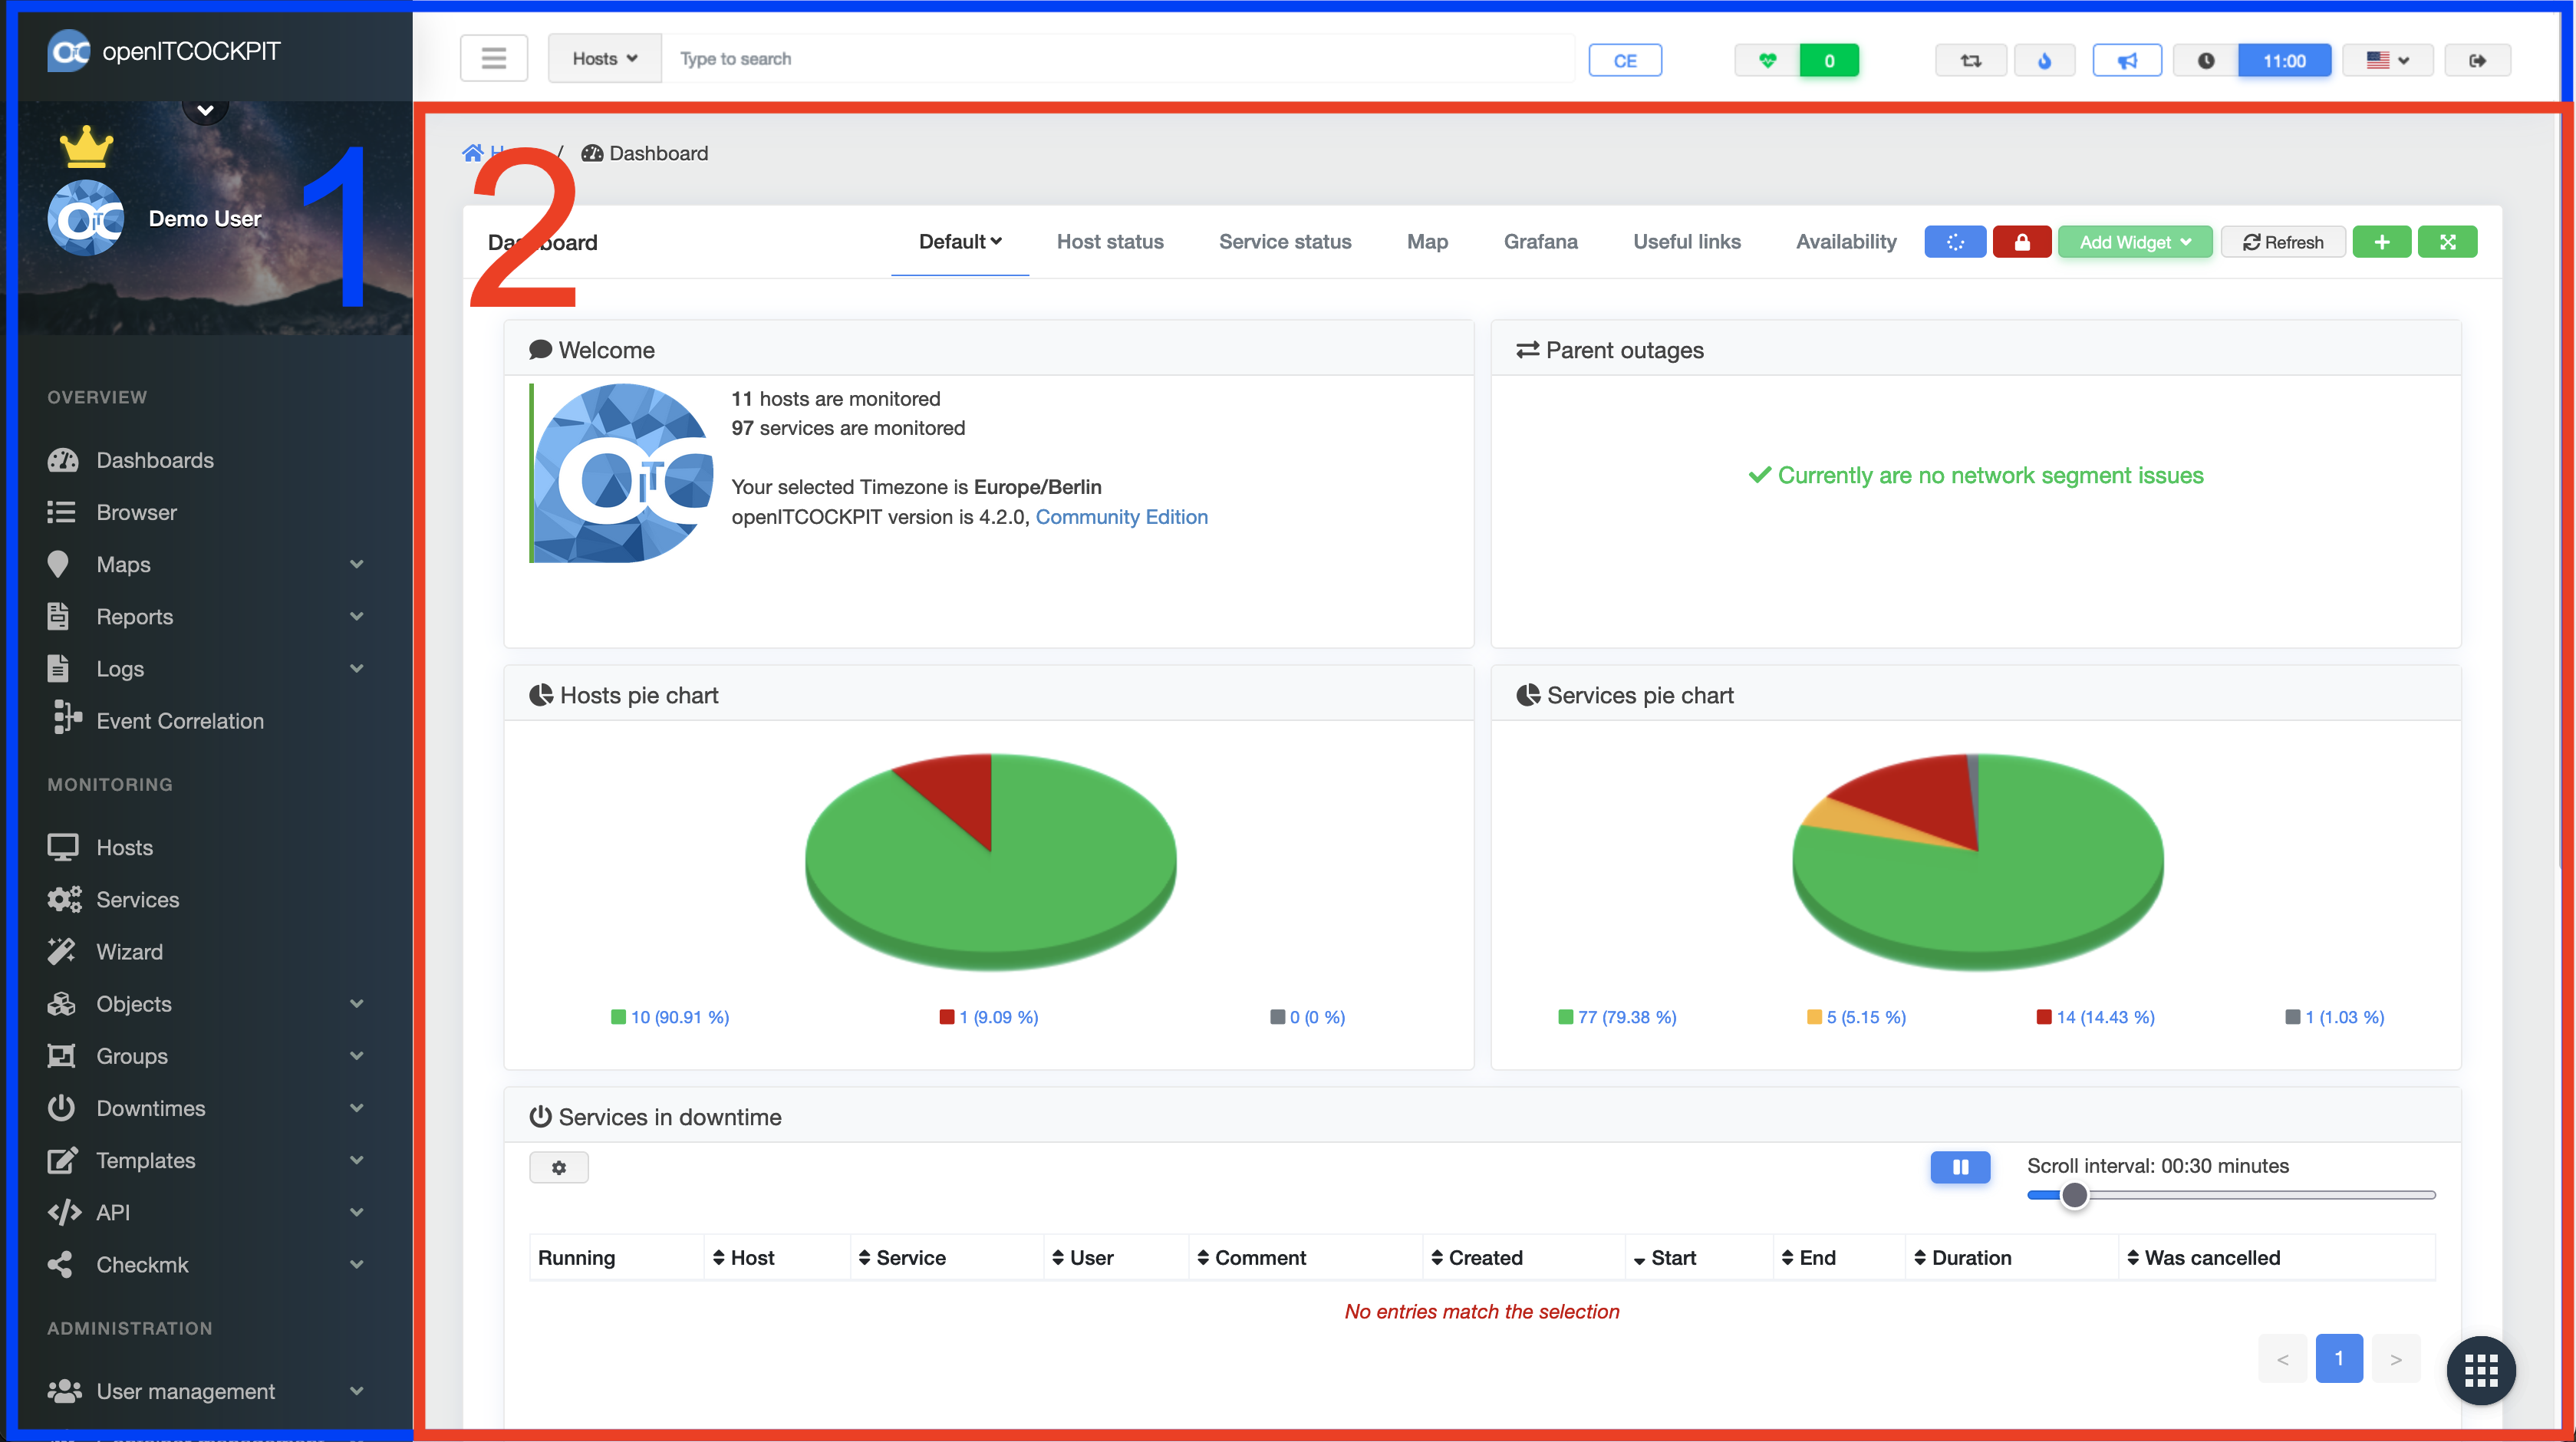
The the user interface is divided into two areas: The navigation area (1. Blue) and the content area (2. Red). The navigation area of openITCOCKPIT always remains the same while the content of the selected page is always displayed in the content area (2).
The navigation area in detail
The top navigation bar

In addition to a search function (2) and the time of day (7), the upper navigation bar contains further short links to various actions
- Button to pop out/close the main menu
- Search bar with the option to search for hosts, services, UUIDs and IP addresses
- Subscription badge - only visible for unregistered and community editions
- System Health
- Export button
- Indicates whether a new openITCOCKPIT version is available. Only visible when a new version is available.
- Displays the Message of the day
- Current (server)time
- Language selection box
- Log-out
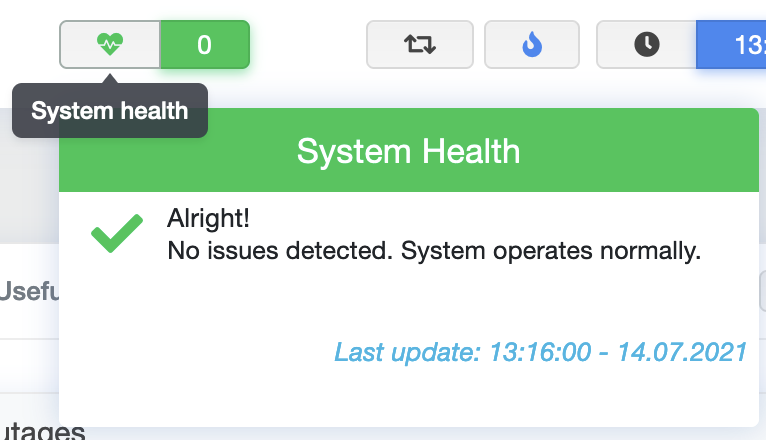
System health
The system health display provides a quick overview of the status of the openITCOCKPIT server. Warnings and critical states, such as insufficient hard disk space, critical memory utilisation and services that are not running, are displayed here. If the display is empty and green, everything is in order and the server is running as expected (see screenshot).
Message of the day
In order to inform all users or selected user groups about a certain event at the same time, openITCOCKPIT offers the
ability to create a Message of the Day. This message is always displayed automatically after logging in.
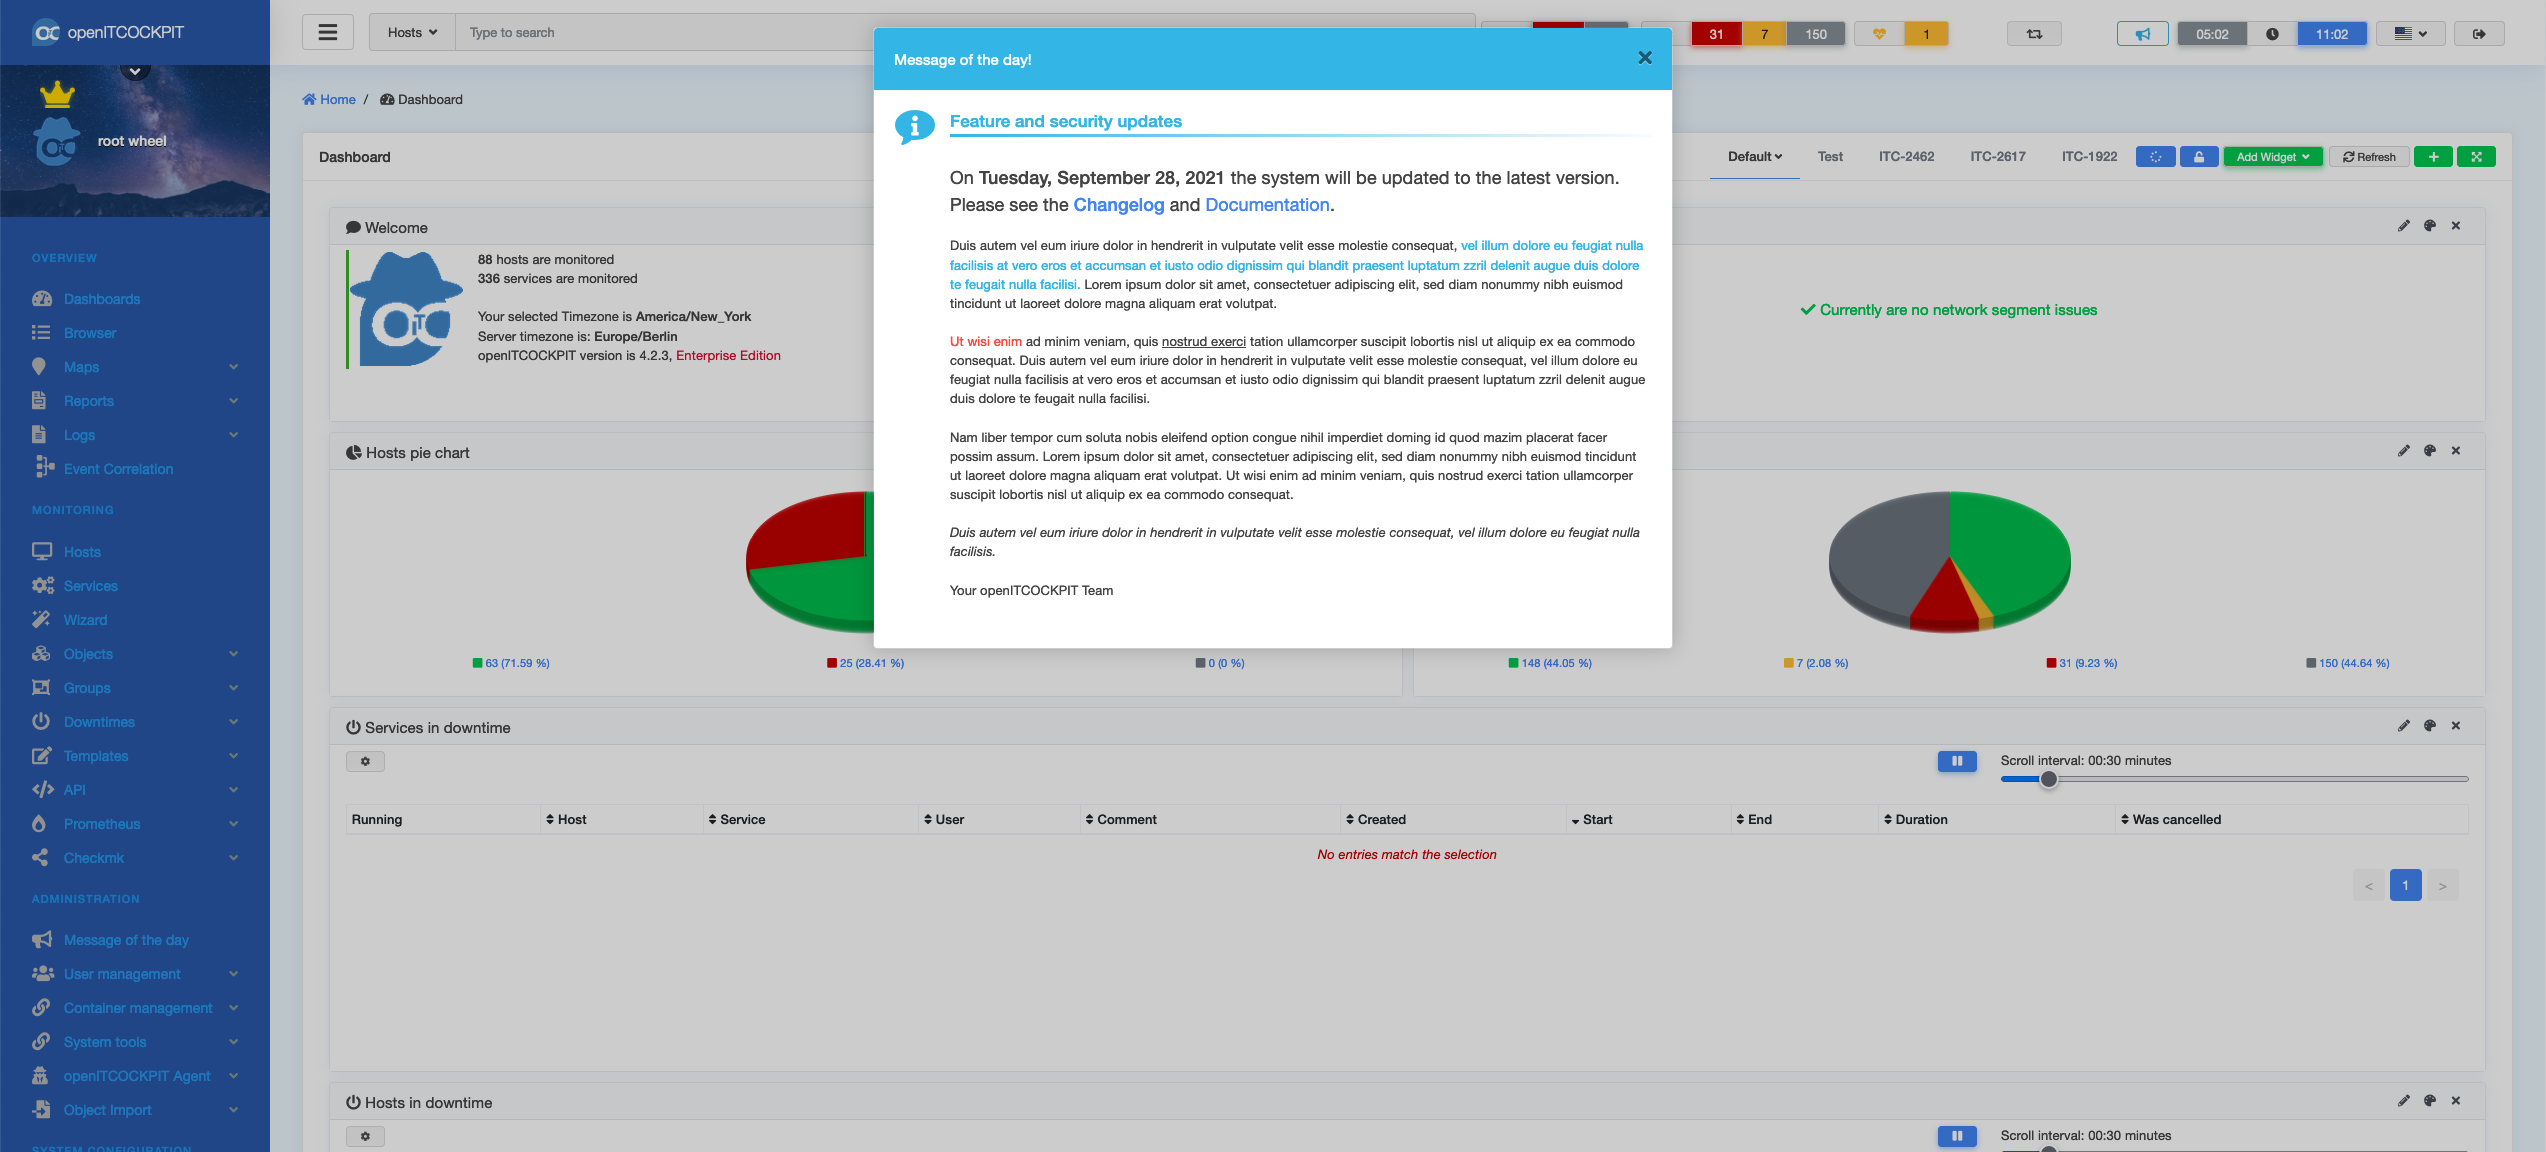
In addition, the Message of the Day can be displayed by clicking on the menu item (7).

The configuration for the Message of the Day can be
found as a separate item under User Administration
System times
The user interface is able to display two different times.

This happens automatically as soon as the local user time (1) differs from the server time (2). Adjustments to the user time zone can be made in the user's profile.
Main menu
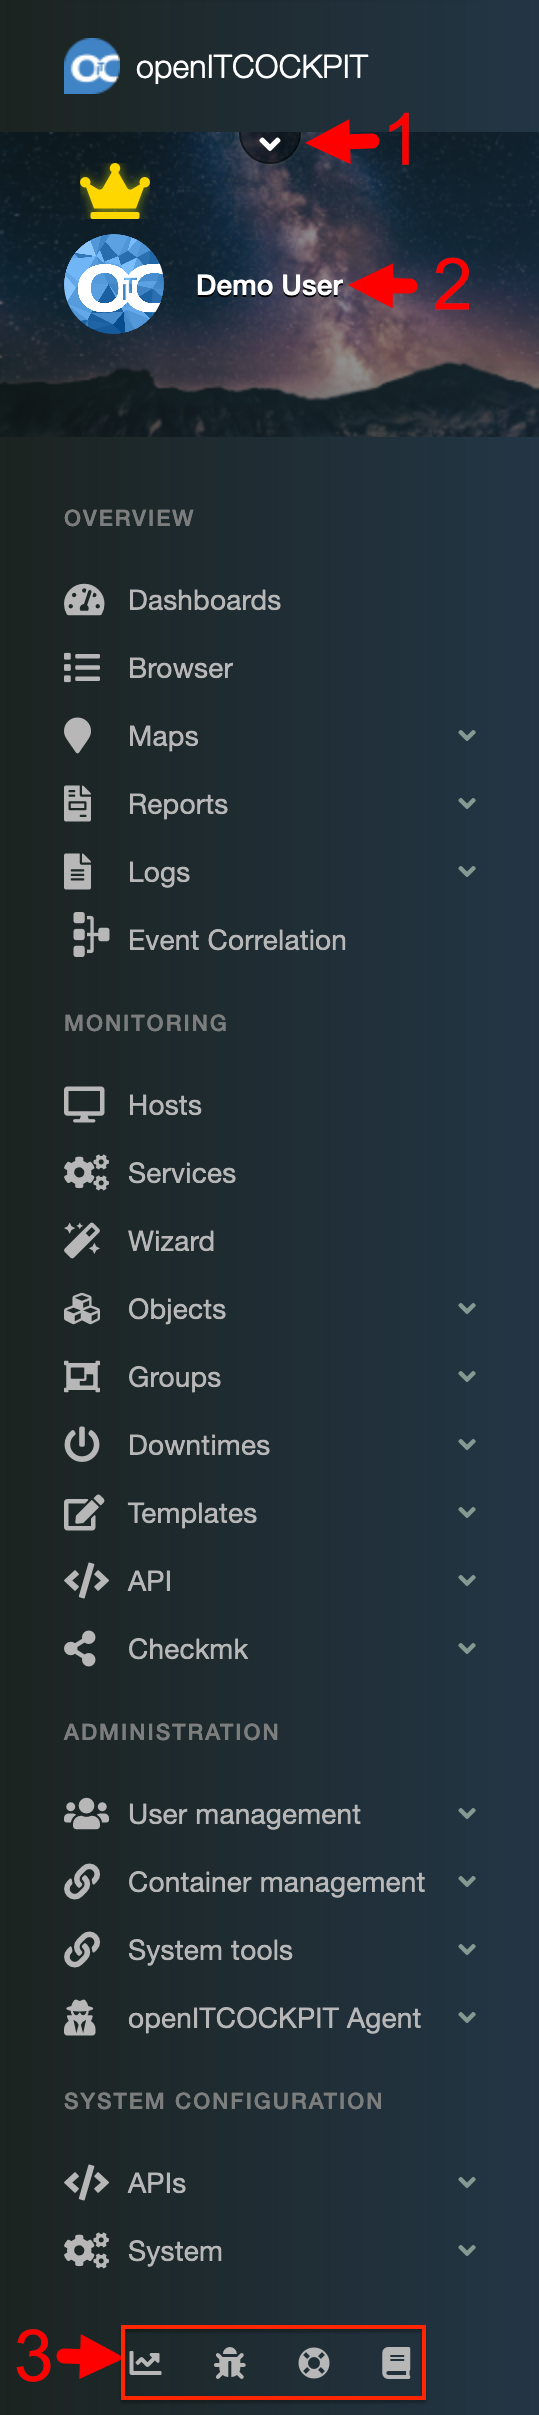
In addition to listing all menu items, the main menu in openITCOCKPIT also offers the ability to search through the menu (1). To do this, just click once on the button. This makes it much easier to find individual menu items.
Below this you will also see your username displayed. The golden crown indicates that administrator rights are available for this user. Clicking on the username will take you to the user profile.
Below the main menu you will find some additional buttons (3):
- links to an overview that allows you to send anonymised statistics to the openITCOCKPIT developer team.
- leads to the support overview page. There you have the ability to report bugs as well as get commercial support.
- links to an overview of the available subscriptions for obtaining commercial support and enterprise modules.
- links to an overview page that contains further links to various documentation.
Profile
In the profile overview, you have the ability to make adjustments to your own user profile.
Profile information
In addition to being able to change your name, email address and telephone number, you can adjust various settings that change the list displays, browser displays and more.
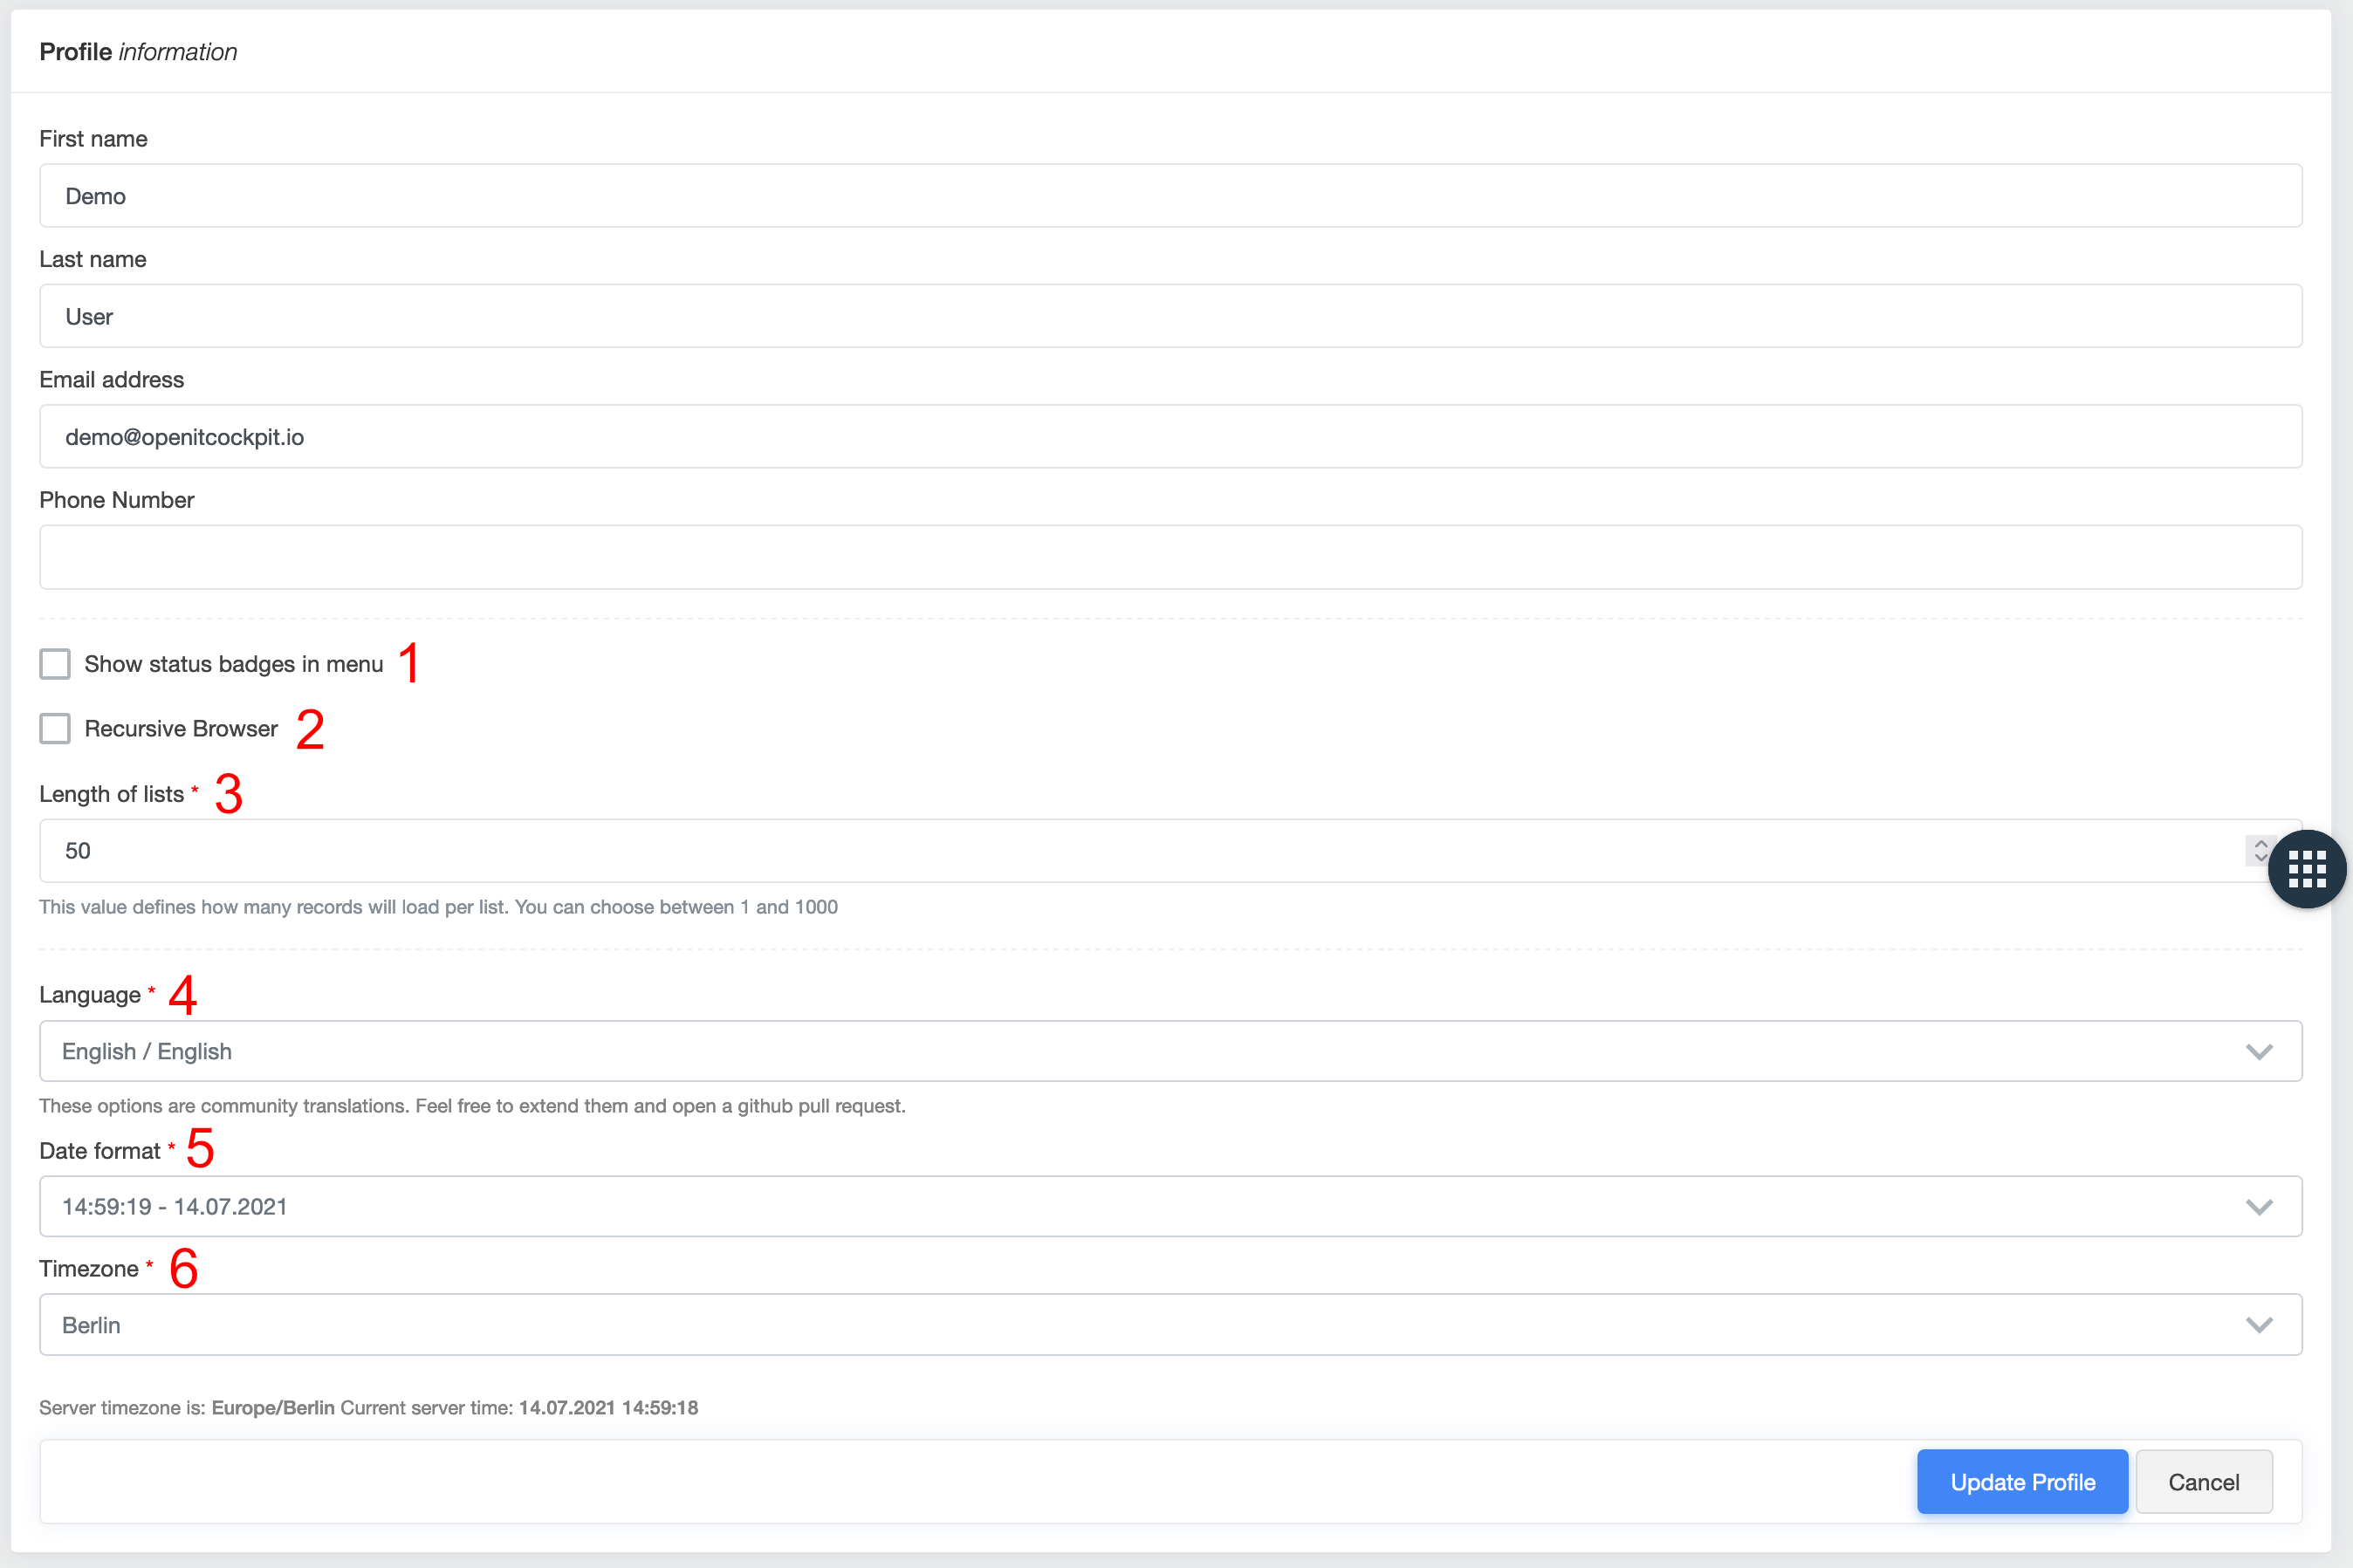
- Displays status information about the monitored objects in the top navigation bar. Header stats
- The recursive browser takes into account the nested elements in the browser below the currently selected container.
- The length of lists affects the list items displayed on a page. This setting has a global effect on all lists.
- The display language for the user can also be changed here.
- The user's desired date format.
- The user's time zone.
Profile picture
To upload a profile picture, you can simply drag and drop the desired picture into the field provided. Uploading and saving is then carried out automatically.

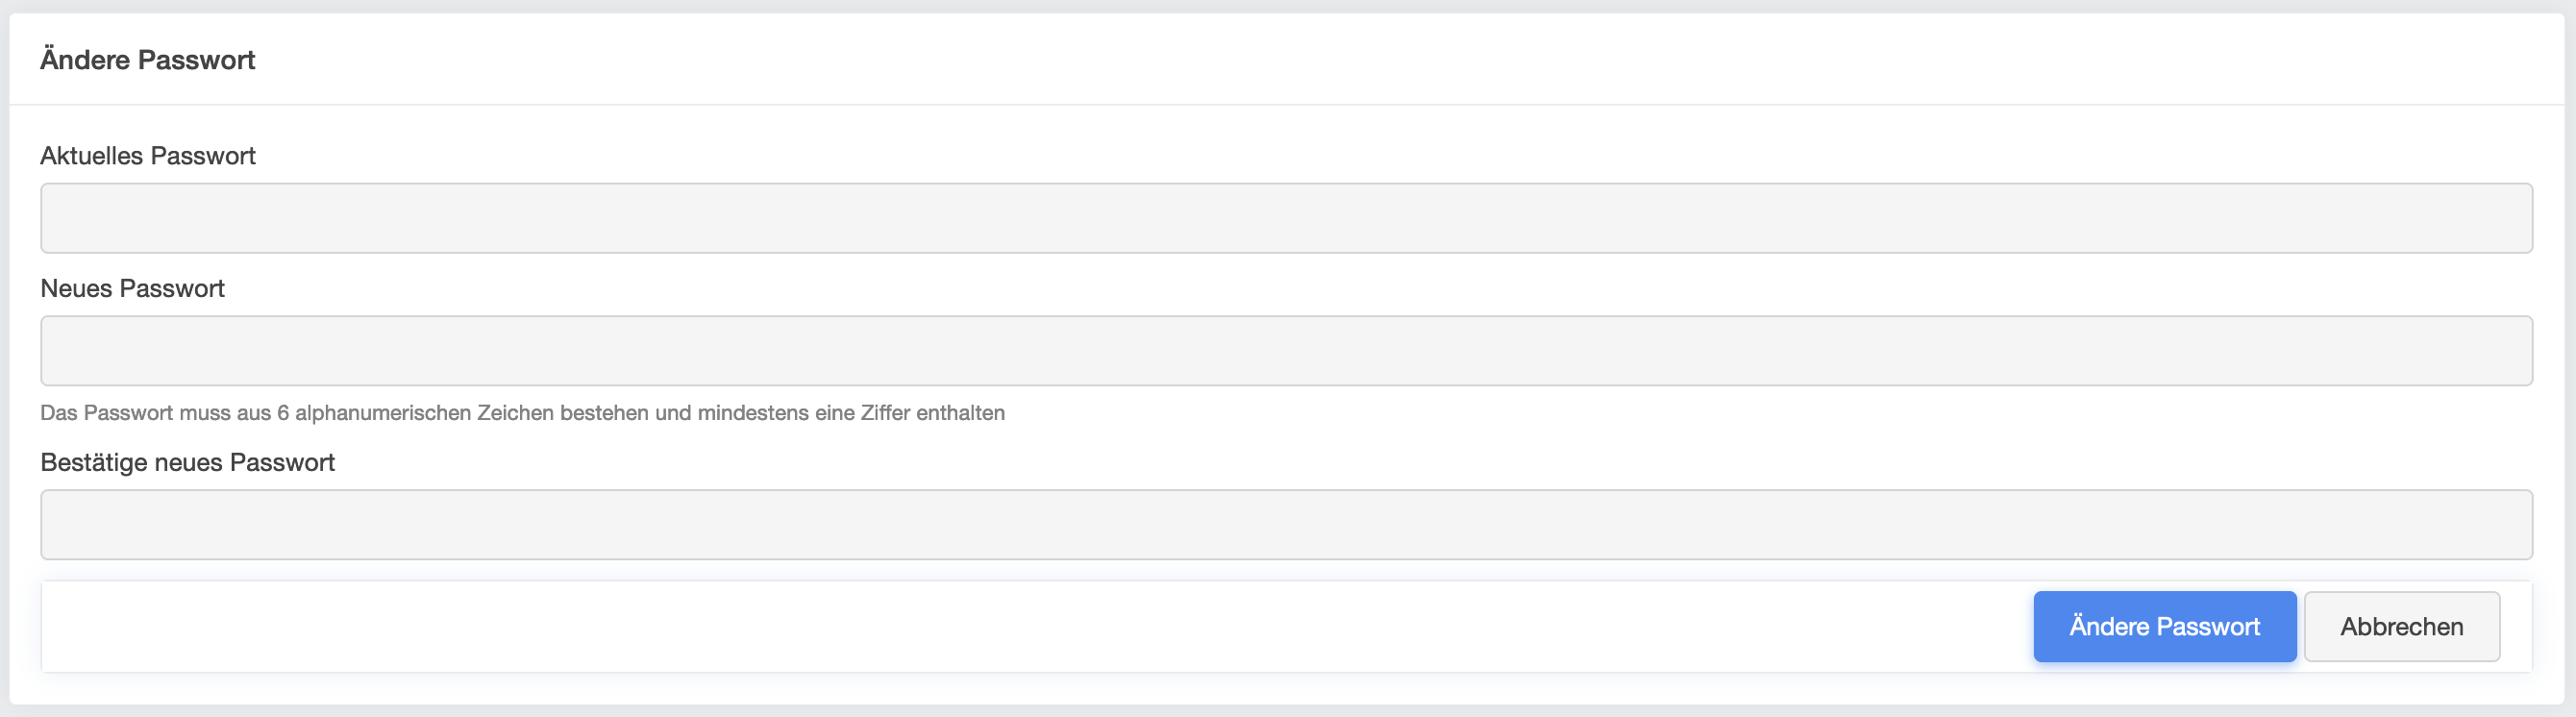
Changing passwords
Info
This option is only available for local users. Users added via LDAP must change their password via the operating system or an LDAP account manager tool.
To change your password, you can use this form. To do this, you must have your old password ready and be ready to assign a new password. The requirements for the new password are at least 6 alphanumeric characters and at least one digit.
API keys
You can create API keys – which are used for authenticating with the openITCOCKPIT API – via your profile. You can find out how to create an API key in a separate article
Browser
The browser provides a user-visible overview of all containers, their hosts and the status of the hosts and services.
The host and service status display shows by default only the status of the hosts and services that are in the currently selected container.
Using the recursive browser setting in your profile settings, the overall status of all hosts and services visible to
a user can be displayed.
Host browser
The host browser provides an overview of the current status of the host and its services. It also provides detailed status and device information, a timeline and, if modules are installed, even more additional information about the host.
Navigation bar
The navigation bar links to various actions on a host

Resetting the check time

This resets the check time of the host. This has the same effect as resetting the check time in the status
information.
Object documentation

Documentation on the host can be entered here
Notifications

To get an overview of all notifications sent to the host, click this button
History

The history contains the results for each host check including date, check attempt, status type and the output
Status history

The status history contains the results of each time the host changes its status.
Confirmation history

The confirmation history contains all confirmations regarding the host status.
Editing hosts

The host can be edited here
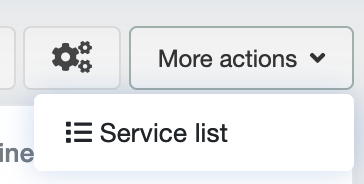
More actions
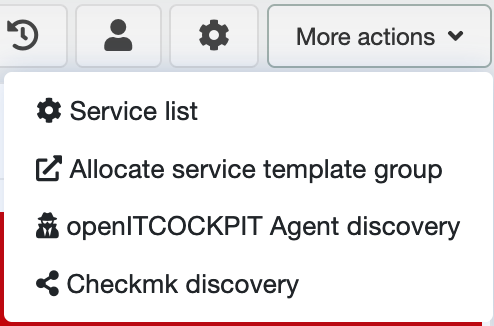
Service list
Here you will find an overview of all available services for the host
Assigning service template groups
You can create service template groups in openITCOCKPIT that are composed of a number of service templates. These groups can then be assigned to a host using this same option. In the form that appears, you can select the appropriate service template group as well as the services to be created. This makes it possible to very quickly create the appropriate services for a host. The configuration must then be exported for the changes to take effect.
openITCOCKPIT Agent Discovery
This can be used to set up an openITCOCKPIT agent. You will be redirected to the Agent Wizard.
Checkmk recognition
A checkmk discovery can be started here.
Status information
The status information contains status-relevant data. In addition to the check parameters and notification settings, this includes a bar that shows the status of the current host. This bar reflects the current status colour and contains information on how long the host has been in this status, when the last check was, when the next check will be, and the status type. You also have the option of performing various actions here.
Resetting the check time
When resetting the check time, the next check is carried out at the next available time (usually immediately). This can be selected either for the host itself or for the host and its services.
Planned maintenance
Using this option, you can set up maintenance times for this host. Here you can specify what exactly is to be included in the maintenance time, a comment on the maintenance being performed as well as the time span (from and to) when the maintenance is to take place.
Individual hosts
With this option, a maintenance time set up for only the host itself.
Hosts including services
BWith this option, the host itself, as well as its services, is entered into a maintenance window.
Hosts and dependent hosts (triggered)
With this option, the host itself, as well as any dependent hosts, is entered into a maintenance window. Here, the start of the maintenance time is triggered by the start of another scheduled host maintenance time.
Hosts and dependent hosts (not triggered)
With this option, the host itself, as well as any dependent hosts, is entered into a maintenance window. Here, the maintenance time starts and stops exactly at the times you set in your maintenance plan.
Acknowledge host status
Depending on the notification settings, notifications for a host are sent at a pre-determined interval. These
notifications can be stopped by confirming the host status. You can also confirm the status for the host and its
services here. The Sticky option retains the confirmation until the host once again returns to an UP status.
Passive transfer of check results
Using the passive transfer of check results, the host receives the specified status with comments.
If Force to hard state is ticked, the host status type is immediately set to HARD and the number of check attempts
is ignored.
Disable notifications
This option allows you to temporarily disable notifications for the host or the host and its services.
Send user-defined host notifications
By selecting this option you can send a custom, user-defined host notification. You can also select whether to force send the message. This ignores the notification period and disabled notifications for the host. In addition, you can select whether the notification should also be sent to the escalation contacts.
Device information
Under device information you can find the host properties. These consist of the IP address / host name, the UUID, which precisely identifies the host in openITCOCKPIT, as well as authorisation information and other properties.
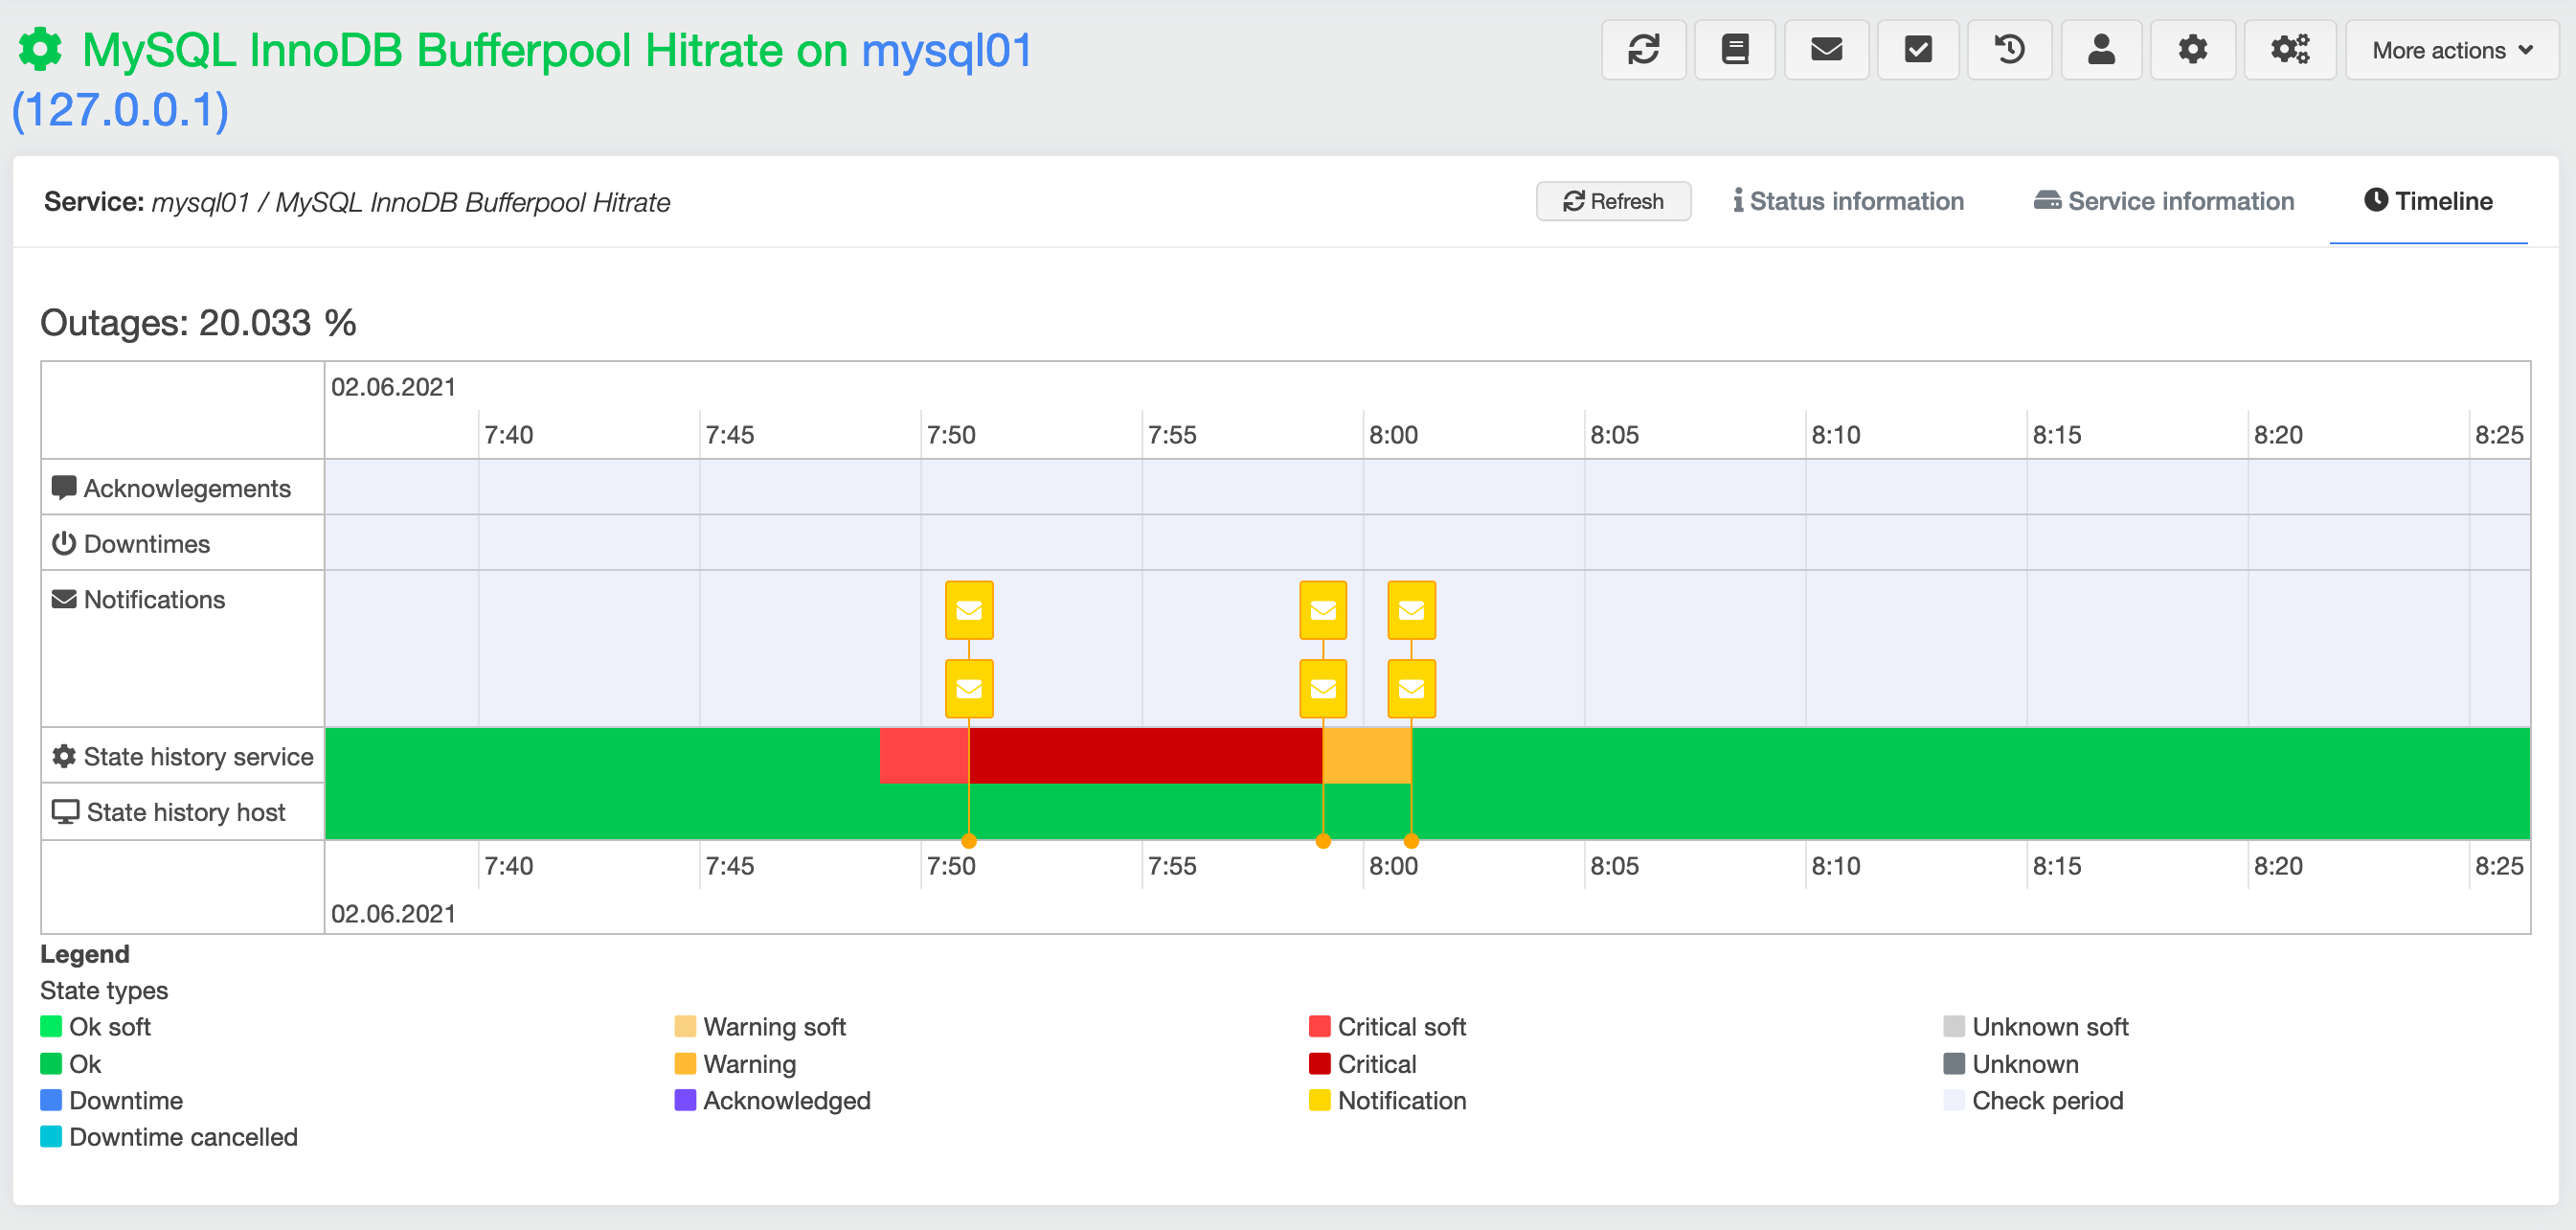
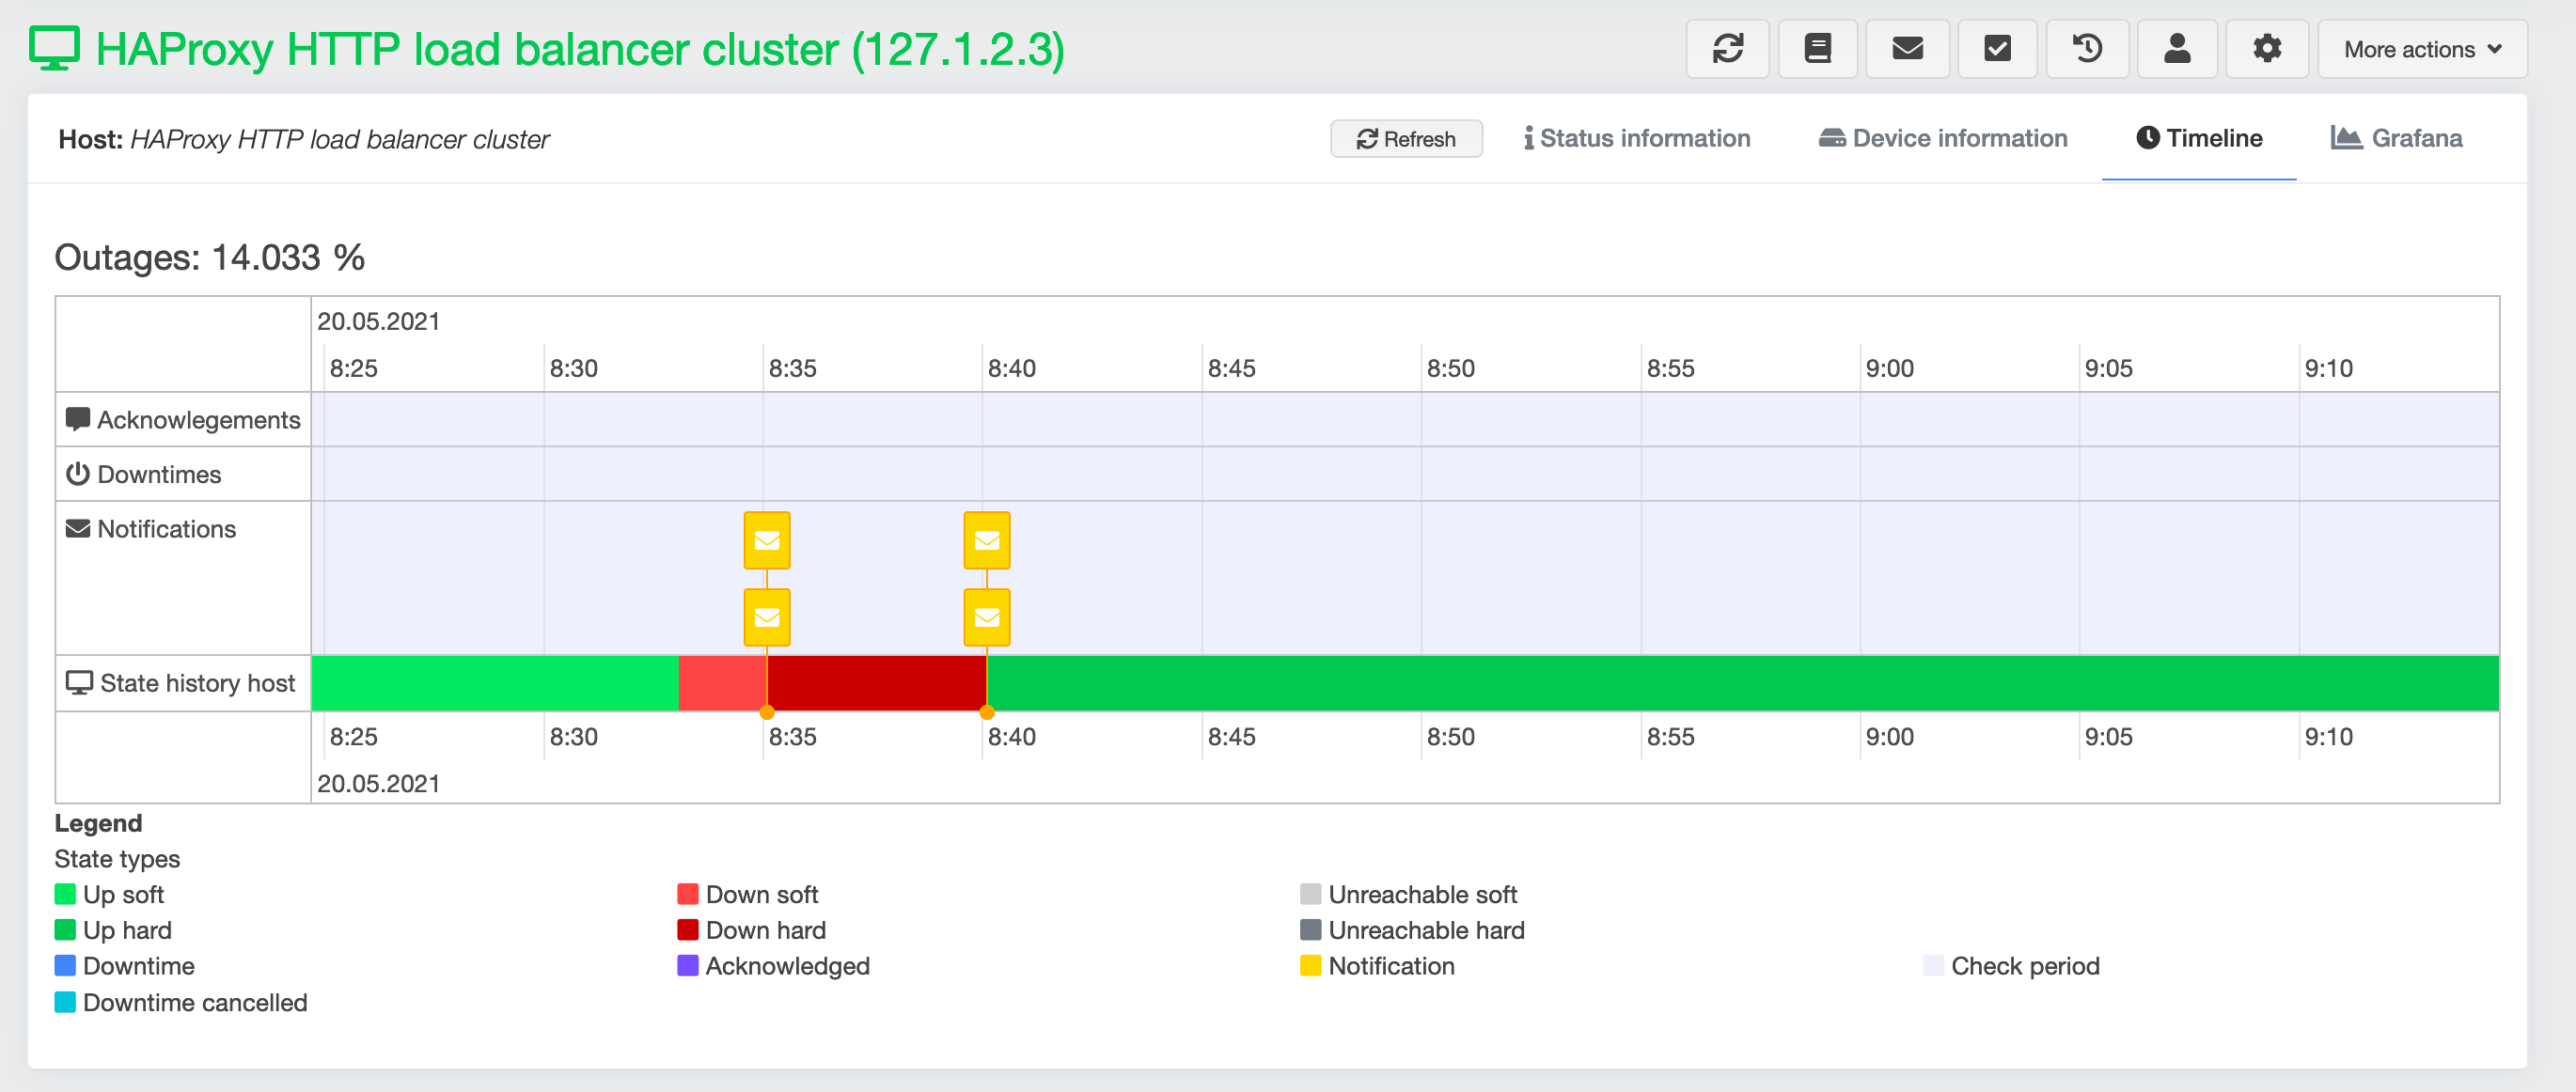
Timeline
The timeline gives an accurate overview of the host as well as what activities have transpired and when. It contains information on when a host status was confirmed, maintenance times were entered into, notifications were sent and when the host had which status.
Grafana
Under the Grafana tab you will find the host’s Grafana dashboard. All available graphs for the host's services are
displayed here.
Service browser
The service browser provides an overview of the current service status. You can also find status and service information, a timeline and, if modules are installed, even more information displayed here.
Navigation bar
The navigation bar links various actions on a service.

Reset the check time
This resets the check time for the service. This has the same effect as resetting the check time in the status
information.
Object documentation
Documentation for the service can be entered here.
Notifications
Click on this button to get an overview of all sent notifications for the service.
History
The history contains the results from each service check including the date, check attempt, status type and output.
Status history
The status history contains the results of each time the service changes its status.
Confirmation history
The confirmation history contains all status confirmations for the service.
Editing hosts
The service host can be edited here.
Editing services
Here you can edit the service itself.
More actions
Service list
Here you will find an overview of all existing services for the same host.
Status information
The status information contains status-relevant data. In addition to the check parameters and notification settings, this includes a bar that displays the status of the current service. This bar is the same colour as the current status colour and contains information about how long the service has been in this status, when the last check was, when the next check will be and the status type. You also have the option of performing various other actions here.
Resetting check times
When resetting the check time, the next check is carried out at the next available time (usually immediately).
Planned maintenance
Using this option, you can set up maintenance times for this service. Here you enter a comment for the maintenance time and the time span (from and until) when the maintenance should take place.
Passive transmission of check results
Using the passive transmission of check results, the service receives the specified status including comments.
If Force to hard status is ticked, the service status type is immediately set to HARD and the number of check
attempts is ignored.
Activating flapping detection
Here you can temporarily activate flapping status detection
Disable notifications
This option allows you to temporarily disable notifications for the service
Send user-defined service notifications
By selecting this option you can send a custom, user-defined service notification. You can also select whether to force send the message. This ignores the notification period and the disabled notifications for the service. In addition, you can select whether the notification should also be sent to the escalation contacts.
Service information
In the service information you will find the properties for the service. These consist of the IP address/host name of the host, the UUIDs that precisely identify the host and service in openITCOCKPIT as well as authorisation information and other properties.
Timeline
The timeline gives an accurate overview of the service, what activities have taken place and when. It contains information on when a service status was confirmed, maintenance times were entered into, notifications were sent and when the service had which status.
The host status is also included.