Graphing Backend
Docker container
The openITCOCKPIT graphing backend runs on various docker containers. We use Docker Compose for managing the containers. All containers can be controlled using systemd.
Starting the graphing backend:
systemctl start openitcockpit-graphing.service
Stopping the graphing backend:
systemctl stop openitcockpit-graphing.service
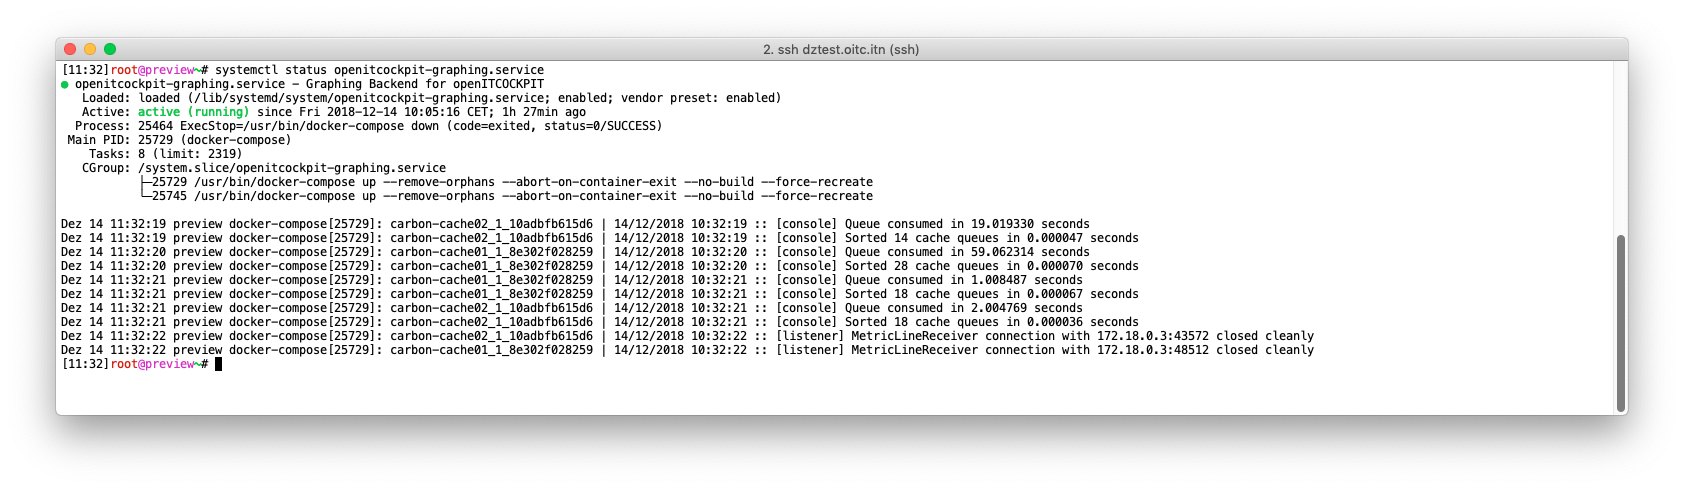
Graphing backend status:
systemctl status openitcockpit-graphing.service
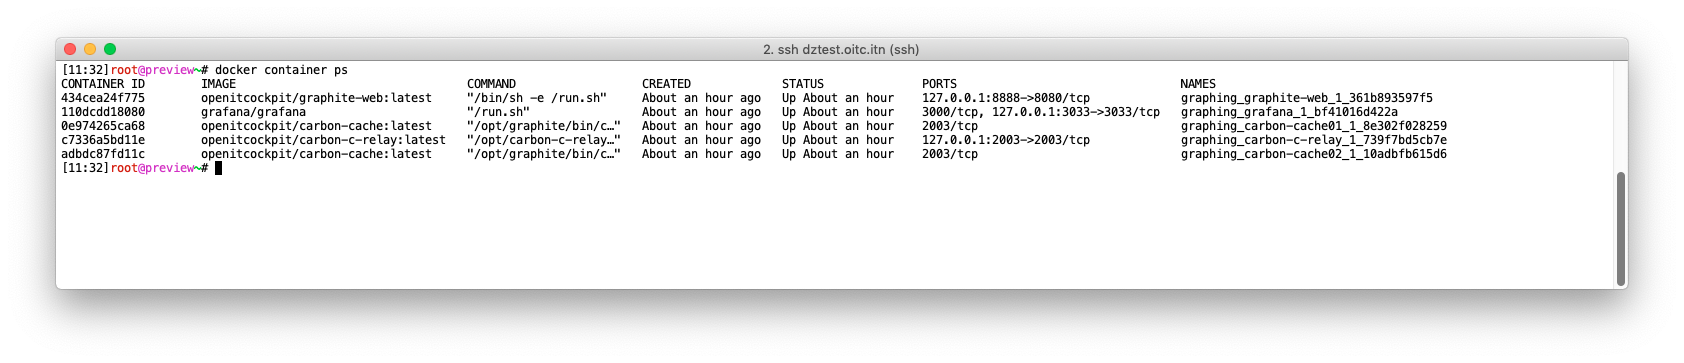
You can also query the status of the containers using the Docker CLI
Graphing backend status:
docker container ps
Log file
cd /opt/openitc/docker/container/graphing
docker-compose logs -f
docker-compose.yml file
The file docker-compose.yml can be found in the following folder:
/opt/openitc/docker/container/graphing/docker-compose.yml
Danger
DO NOT MANUALLY EDIT the docker-compose file as it is automatically generated by openITCOCKPIT!
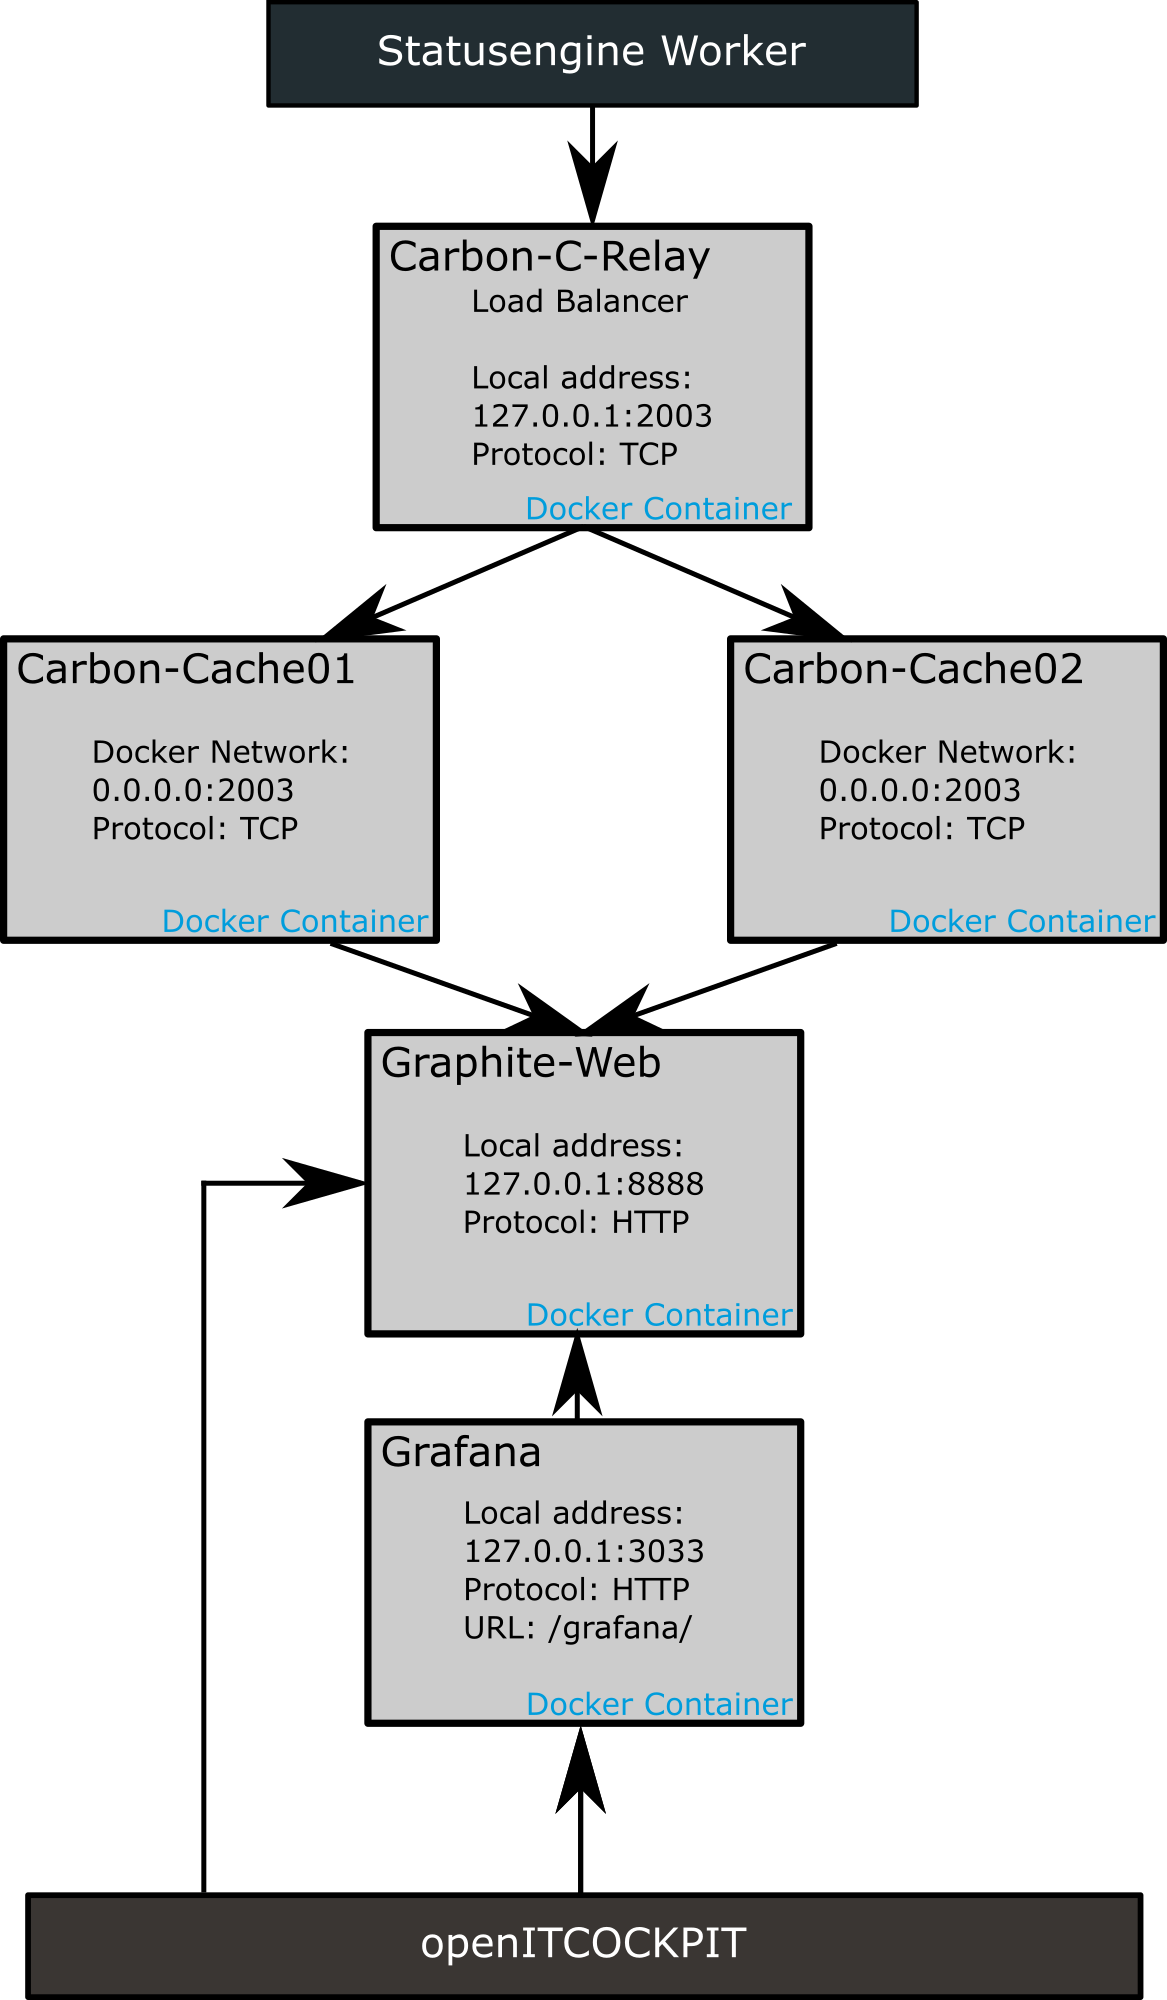
Carbon-C-Relay
The carbon-c-relay is a load balancer for several carbon-cache instances.
The standard LINE_RECEIVER_PORT PORT (plain text protocol based on TCP) is 2003 and is opened on 127.0.0.1:2003
geöffnet.
You can change the port used via the openITCOCKPIT web interface.
The configuration file is automatically generated under /opt/openitc/etc/carbon/carbon-c-relay.conf.
Carbon-Cache instances
The carbon-cache instances read and write data from the Whisper files.
The default whisper path on the openITCOCKPIT server is /var/lib/graphite/whisper.
The configuration file is automatically generated under /opt/openitc/etc/carbon/carbon.conf.
Graphite-Web
The configuration file is automatically generated under Carbon-Cache instances.
The configuration file is automatically generated under /opt/openitc/etc/carbon/local_settings.py.
Grafana
Grafana is a powerful and easy-to-use tool for creating graph-based dashboards. It runs in the background and is used by openITCOCKPIT via the API.
The Grafana web interface can be accessed via the URL https://<openITCOCKPIT-adresse>/grafana/.
The configuration file is automatically generated under /opt/openitc/etc/grafana/grafana.ini.
The user name for the Grafana web interface is admin.
A randomly generated password is created during the installation process. It is saved under /opt/openitc/etc/grafana/admin_password.
The API key used by openITCOCKPIT is saved in the file /opt/openitc/etc/grafana/api_key.
Location of the Whisper files
By default, all Whisper files are stored in the folder /var/lib/graphite/whisper.
The storage scheme is /var/lib/graphite/whisper/<prefix>/<$HOSTNAME$>/<$SERVICEDESC$>/<$METRIC$>.wsp.
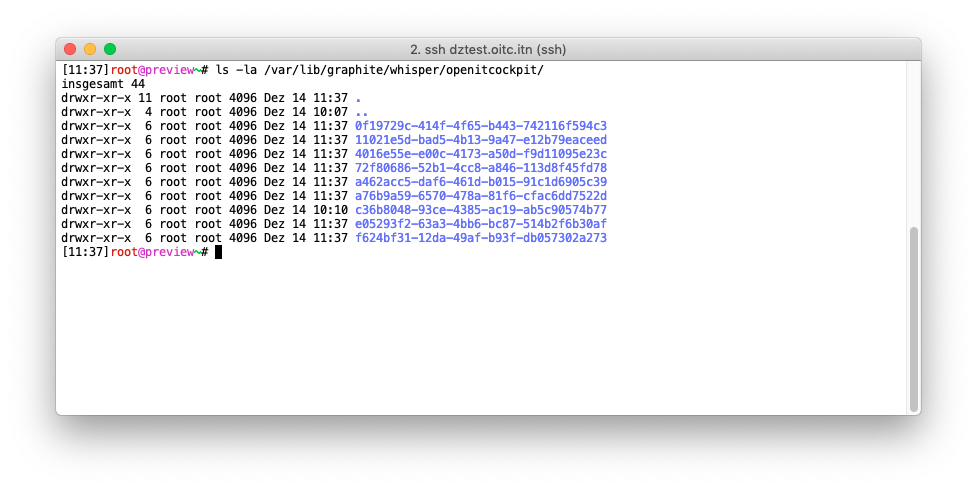
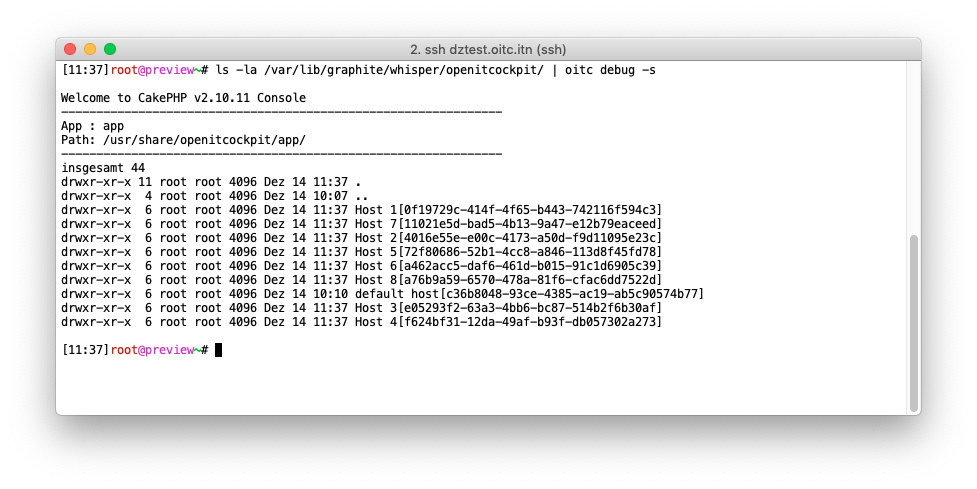
You can use the openITCOCKPIT debugging tool to replace the UUIDs with host and service names.
ls -la /var/lib/graphite/whisper/openitcockpit/ | oitc debug -s
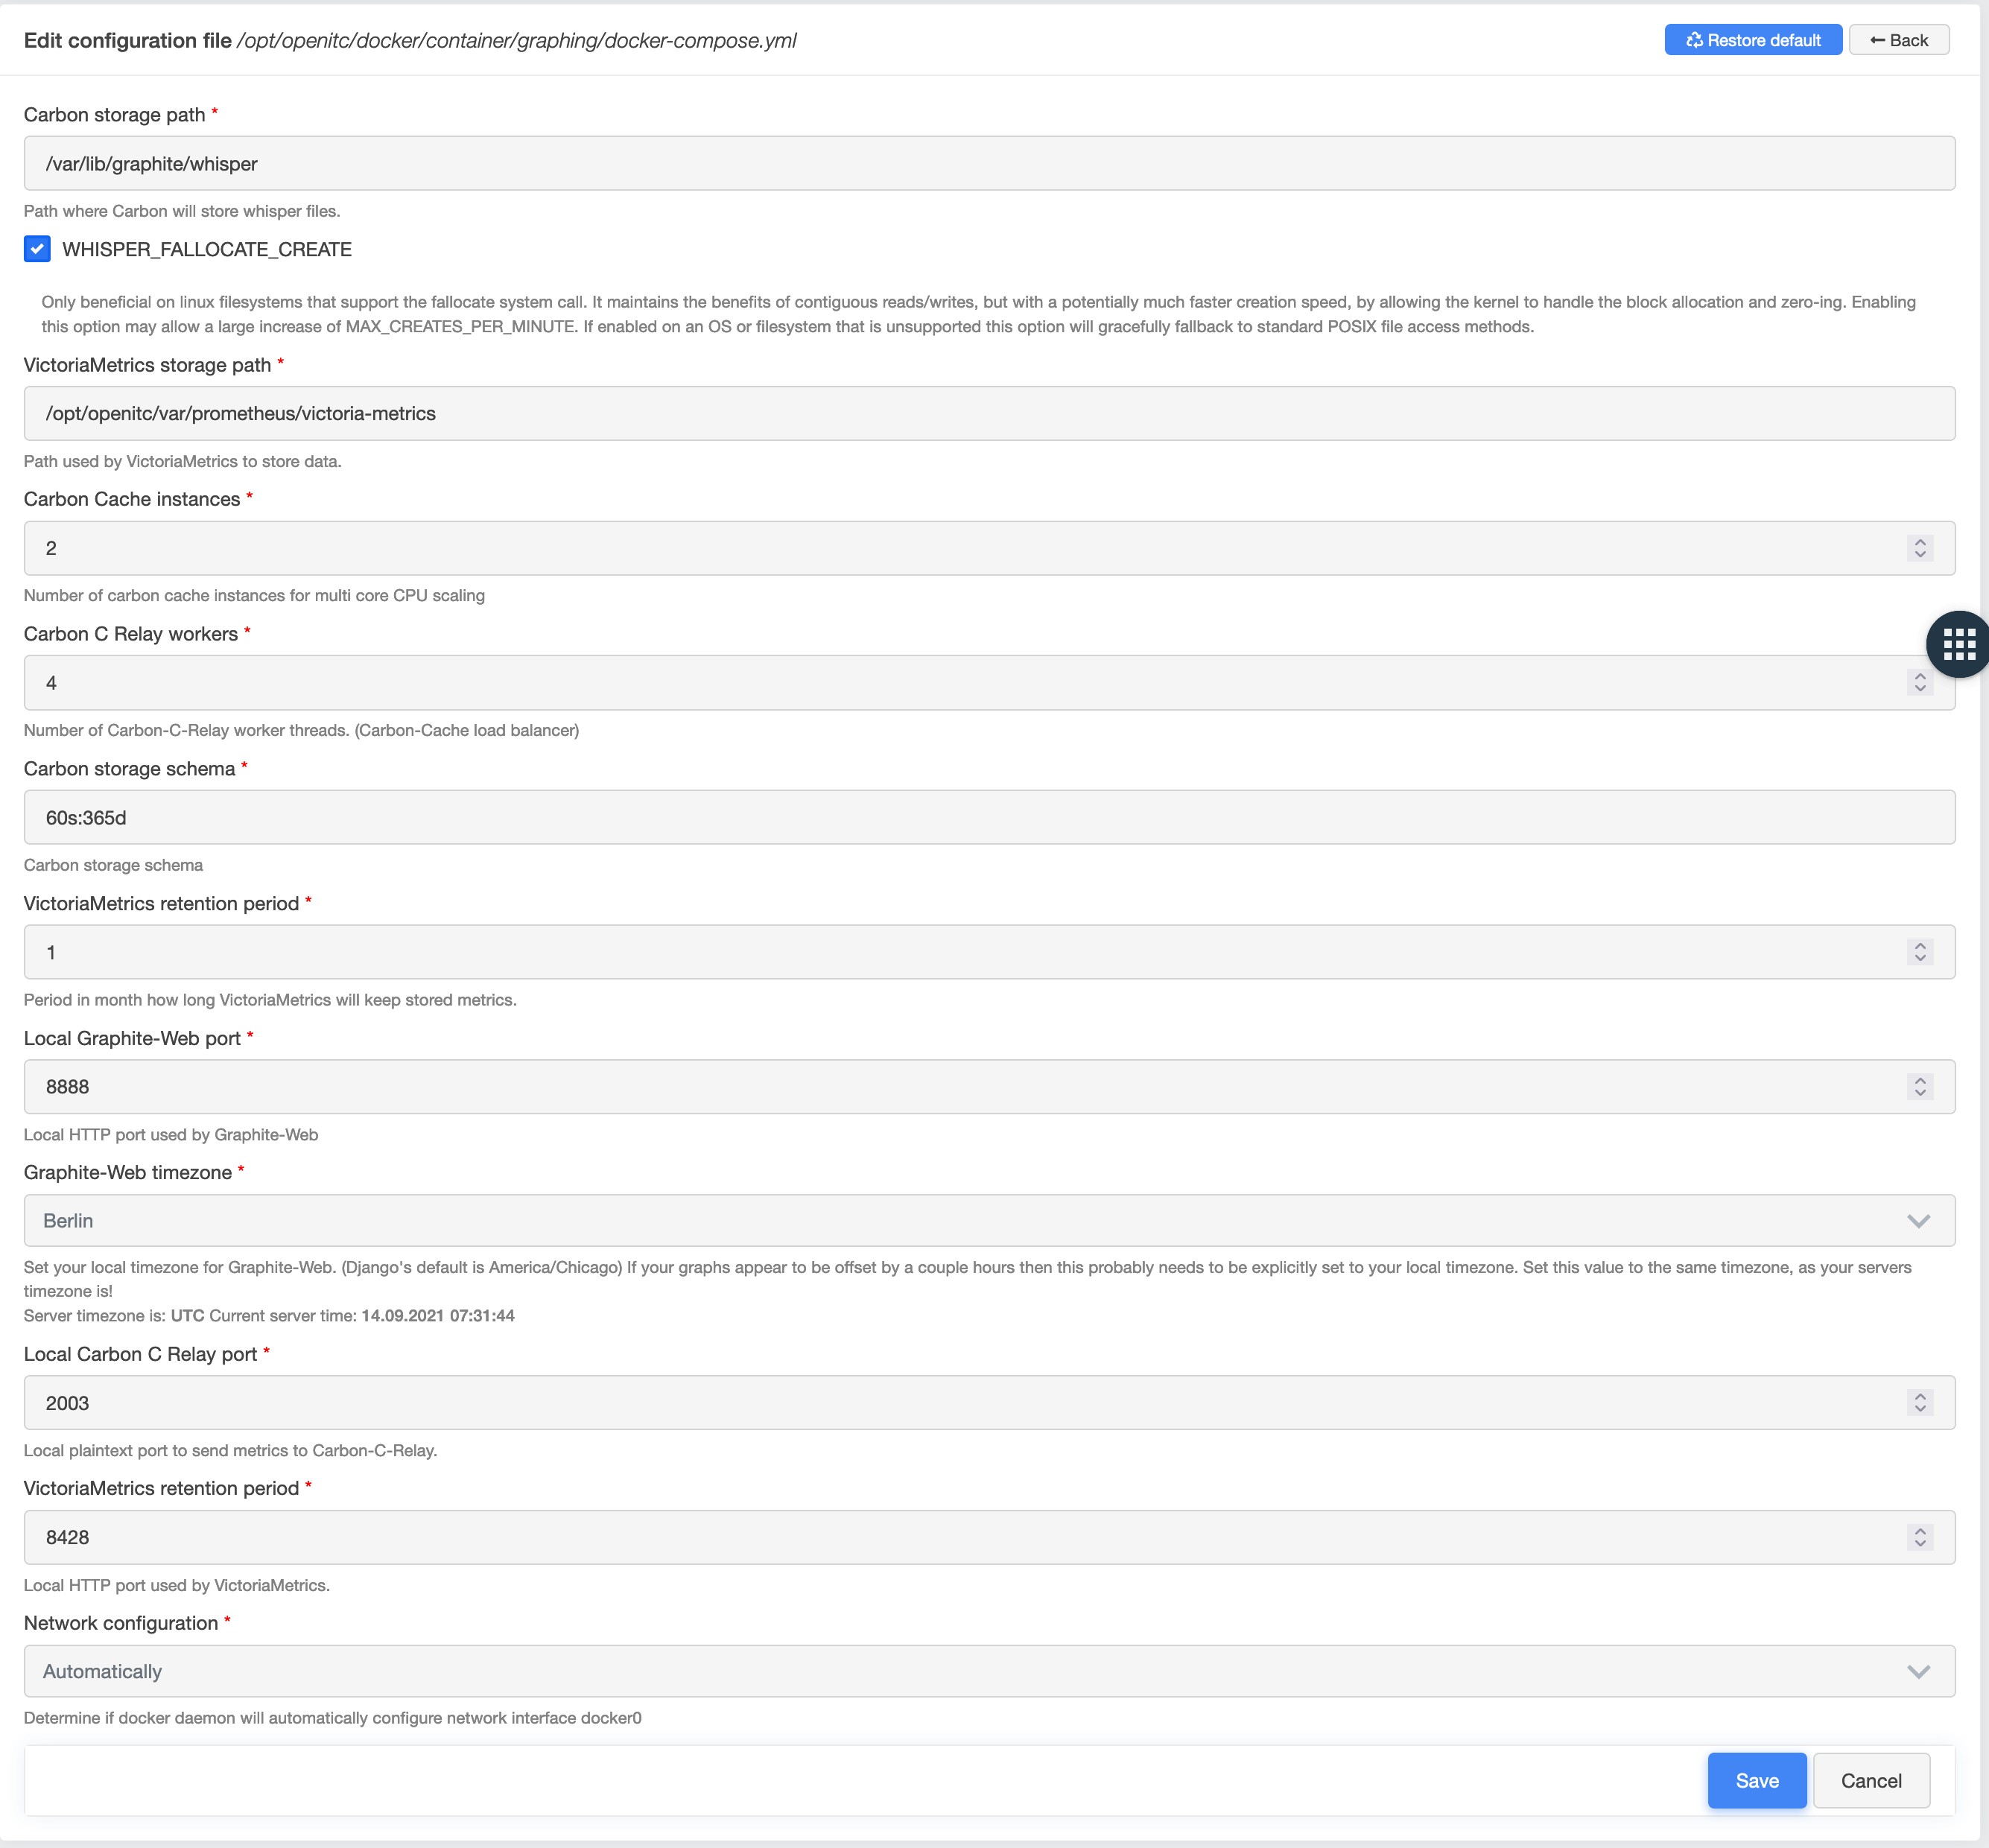
Changing the configuration
If required, you can adjust the configuration of the graphing backend via the openITCOCKPIT web interface.
To do this, navigate to System configuration -> System -> Configuration file editor and select the file docker-compose.yml of the graphing backend.

In the next step, you can modify all the important settings such as the storage path or the number of carbon cache instances.
Overview
Use the supplied Graphite and Grafana servers (standard and recommended)
openITCOCKPIT is supplied with several Docker containers.
By default, the system uses the supplied Docker container for saving performance data.
This section of the documentation describes the default values for this configuration.
Saving performance data in the supplied Graphite instance
To save your performance data, navigate to System configuration -> System -> Configuration file editor and select the file statusengine.php.

| Configuration key | Default name | Description |
|---|---|---|
| graphite_port | 2003 | Carbon-Cache server adress (open LINE_RECEIVER_PORT of the Carbon-C relay) |
| graphite_address | 127.0.0.1 | Carbon-Cache server address (open address of the Carbon-C relay) |
| graphite_prefix | openitcockpit | Prefix that is added to each metric in Carbon (Metric: |
Reading performance data in the supplied Graphite
To do this, navigate to System configuration -> System -> Configuration file editor and select the file statusengine.php.

| Configuration key | Default value | Description |
|---|---|---|
| graphite_web_host | 127.0.0.1 | Address of the Graphite web server that openITCOCKPIT uses to query data from the Whisper files |
| graphite_prefix | openitcockpit | Prefix that is added to each metric in Carbon (Metric: |
| graphite_web_port | 8888 | Graphite web server port |
| use_https | No | Determines whether HTTPS should be used for establishing the connection. Not required for locally running Graphite web instances |
| use_proxy | No | Determines whether the proxy server should be used. Not required for locally running Graphite web instances |
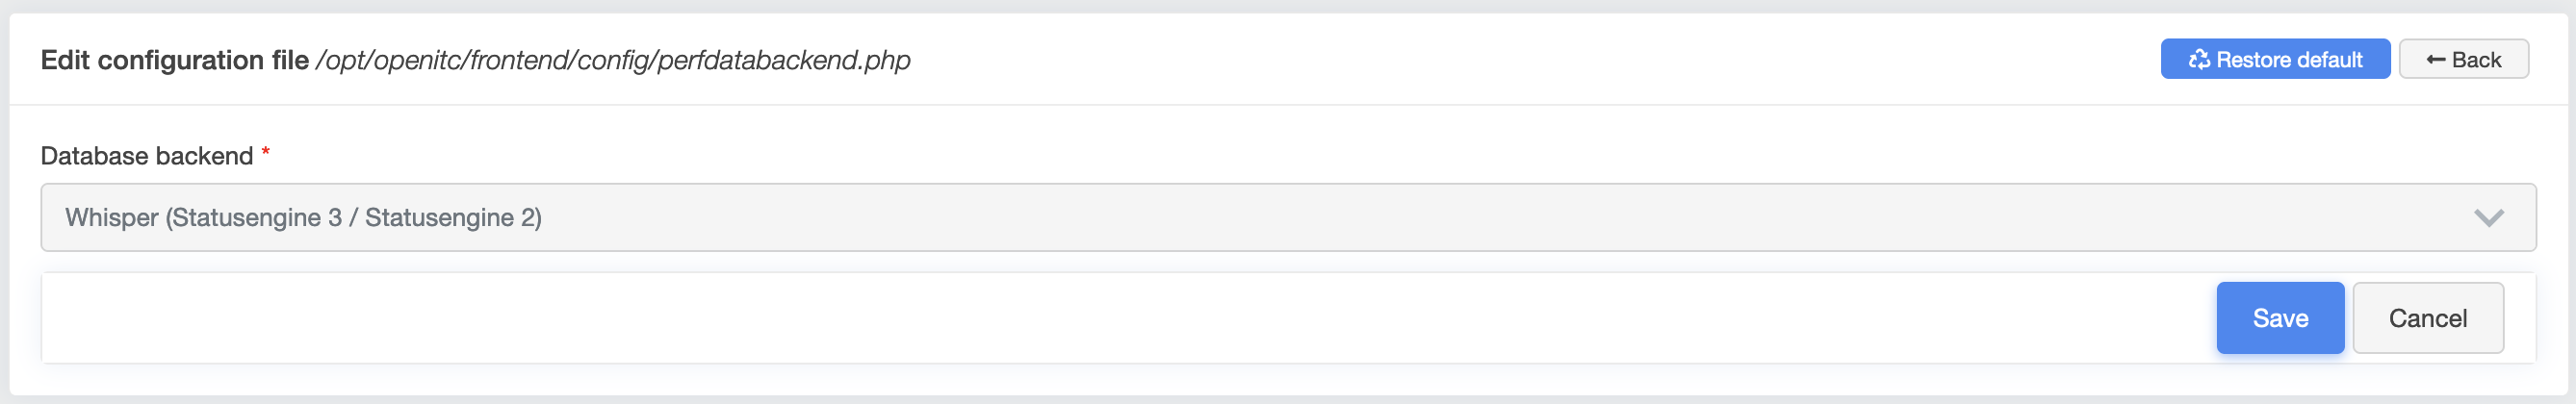
Now open the perfdatabackend.php configuration file and make sure that the selected backend is Whisper.

Configuration for using the supplied instance of Grafana with the supplied instance of Graphite
Navigate to Systemkonfiguration -> APIs -> Grafana
| Configuration key | Default value | Description |
|---|---|---|
| Grafana URL | grafana.docker | Address of the Grafana server. grafana.docker is automatically resolved to the supplied Grafana instance. |
| Grafana API key | Randomly generated | Saved under /opt/openitc/etc/grafana/api_key. Use the value found in this file.. |
| Grafana Prefix | openitcockpit | Prefix that is added to each metric in Carbon (Metric: |
| Establish a connection via HTTPS | Yes | Determines whether HTTPS should be used to establish a connection. |
| Use proxy | No | Determines whether the proxy server should be used. |
| Ignore SSL certificate | Yes | Self-signed certificates are trusted |
| Dashboard style | Light | Use the light or dark style for Grafana |
| Host group | empty | If this value is set, Grafana dashboards will be generated for all hosts in the specified host group(s) (if left empty, a dashboard will be generated for all hosts) |
| Host groups (excluded) | empty | If set to no, Grafana dashboards will be created for the hosts in the specified host groups |
Use external Graphite and Grafana servers (experts)
In order to distribute the system load to different nodes, you can select the option for configuring external systems to store your performance data.
Saving performance data in an external Graphite instance
To do this, navigate to System System configuration -> System -> Configuration file editor and select the file statusengine.php.
| Configuration key | Value | Description |
|---|---|---|
| graphite_port | 2003 | Standard LINE_RECEIVER_PORT from Graphite) |
| graphite_address | xxx.xxx.xxx.xxx | Host name or IP address of the external Graphite server |
| graphite_prefix | openitcockpit | Prefix that is added to each metric in Carbon (Metric: |
Reading performance data from an external source (openITCOCKPIT itself)
To accomplish this, navigate System configuration -> System -> Configuration file editor and select the file statusengine.php.
| Configuration key | Value | Description |
|---|---|---|
| graphite_web_host | xxx.xxx.xxx.xxx | Host name or IP address of the external Graphite web server |
| graphite_prefix | openitcockpit | Prefix that is added to each metric in Carbon (Metric: |
| graphite_web_port | 80 | Graphite web server port |
| use_https | Yes/No | Determines whether HTTPS should be used for establishing the connection. |
| use_proxy | Yes/No | Determines whether the proxy server should be used. |
In the next step, open the perfdatabackend.php configuration file and make sure that the selected backend is Whisper.
Configuration for using external Grafana with external Graphite instance
Navigate to System configuration -> APIs -> Grafana
| Configuration key | Value | Description |
|---|---|---|
| Grafana URL | xxx.xxx.xxx.xxx | Address of the external Grafana server |
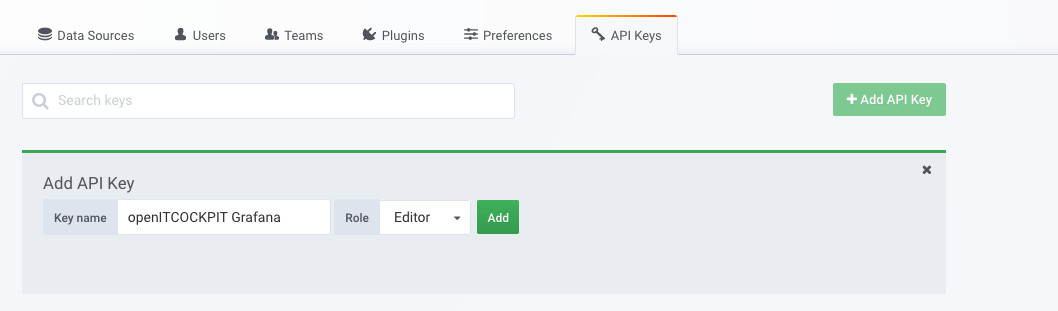
| Grafana API key | Randomly generated | A Grafana API key with "Editor" permissions must be generated |
| Grafana Prefix | openitcockpit | Prefix that is added to each metric in Carbon (Metric: |
| Establish a connection via HTTPS | Yes/No | Determines whether HTTPS should be used to establish a connection. |
| Use proxy | Yes/No | Determines whether the proxy server should be used |
| Ignore SSL certificate | Yes/No | Self-signed certificates will be trusted |
| Dashboard style | light | Use the light or dark style for Grafana |
| Host group | empty | If this value is set, Grafana dashboards will be generated for all hosts in the specified host group(s) (if left empty, a dashboard will be generated for all hosts) |
| Host groups (excluded) | empty | If set to no, Grafana dashboards will be created for the hosts in the specified host groups |
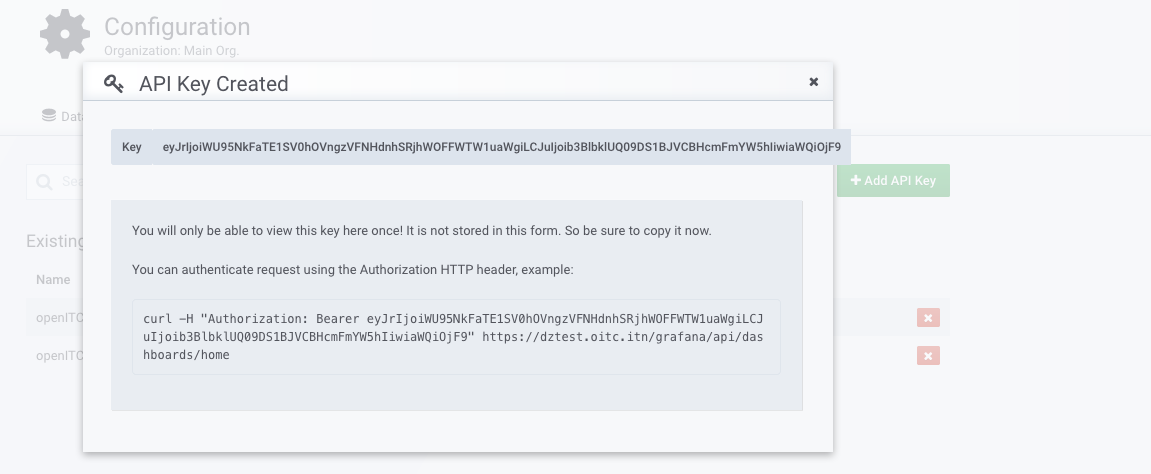
Generate Grafana API key
Migrating from RRDTool to Whisper
As of openITCOCKPIT 3.6, performance data (used for graphs) is stored in Whisper (Carbon).
Info
No automatic migration takes place if you upgrade from an older version of openITCOCKPIT to version 3.6 or newer. For this reason, empty graphs will be displayed until new data has been collected.
To ensure that migrating from RRDTool to Whisper is as easy as possible, we offer our own tool: rrd2whisper
Downloading and installing rrd2whisper
We provide our own rrd2whisper packages for every supported distribution on the official download page.
Internet connection required
To install rrd2whisper, a working Internet connection is required. If you need an HTTP proxy connection, you will need to configure this first
sudo wget -O /usr/local/bin/rrd2whisper https://github.com/openITCOCKPIT/rrd2whisper/releases/download/v2.0.1/rrd2whisper_v2.0.1_$(lsb_release -sc)_amd64
sudo chmod +x /usr/local/bin/rrd2whisper
sudo apt-get install rrdtool
rrd2whisper will now be installed under the following path: /opt/rrd2whisper.
Begin migration
The migration process will read all .rrd files from /opt/openitc/nagios/share/perfdata and save them as .wsp files under var/lib/graphite/whisper.
Warning
Make sure you have enough free hard disk space available before you start the migration. Whisper needs about half the space that RRDTool requires.
Test the migration
Before you begin migrating all your files, you should first perform a test with a single .rrd file.
sudo /usr/local/bin/rrd2whisper -limit 1
Using the parameter --limit 1 only a single file will be processed. You should then see output similar to this:

In this example, the service was migrated with the UUID b123beaf-0575-4ec4-b353-328df2fba0e3. As the next step, you should now open the openITCOCKPIT web interface and search for this UUID, making sure the graph includes the migrated performance data.
Perform the migration
After confirming your test was successful, you can now migrate all your performance data.
Info
The migration process can take several hours to complete depending on the amount of performance data to be migrated. The migration process will not influence your monitoring activities. New performance data will be merged.
Migrating with standard parameters:
sudo /usr/local/bin/rrd2whisper
/var/log/rrd2whisper.log.
Use the parameter --help to be able to see all options.
sudo /usr/local/bin/rrd2whisper -help
Failed migrations
In the event that the migration fails or other unexpected errors appear, you can start the migration over again. Every successfully processed .rrd file is marked with .ok , so that no entries are ever migrated twice.
[16:02]root@graphing/tmp# ls /opt/openitc/nagios/share/perfdata/abfb63a8-5187-46bf-a6f1-5120fcac66b6/*
/opt/openitc/nagios/share/perfdata/abfb63a8-5187-46bf-a6f1-5120fcac66b6/279b7b4a-4812-4bc5-a251-cec81e11a705.ok
/opt/openitc/nagios/share/perfdata/abfb63a8-5187-46bf-a6f1-5120fcac66b6/279b7b4a-4812-4bc5-a251-cec81e11a705.rrd
/opt/openitc/nagios/share/perfdata/abfb63a8-5187-46bf-a6f1-5120fcac66b6/279b7b4a-4812-4bc5-a251-cec81e11a705.xml
/opt/openitc/nagios/share/perfdata/abfb63a8-5187-46bf-a6f1-5120fcac66b6/27e67fe9-16fd-4ce2-90d1-442e1e7a1164.ok
/opt/openitc/nagios/share/perfdata/abfb63a8-5187-46bf-a6f1-5120fcac66b6/27e67fe9-16fd-4ce2-90d1-442e1e7a1164.rrd
/opt/openitc/nagios/share/perfdata/abfb63a8-5187-46bf-a6f1-5120fcac66b6/27e67fe9-16fd-4ce2-90d1-442e1e7a1164.xml
/opt/openitc/nagios/share/perfdata/abfb63a8-5187-46bf-a6f1-5120fcac66b6/30a267ae-05a4-432a-9066-15d14eb6a6e8.ok
/opt/openitc/nagios/share/perfdata/abfb63a8-5187-46bf-a6f1-5120fcac66b6/30a267ae-05a4-432a-9066-15d14eb6a6e8.rrd
/opt/openitc/nagios/share/perfdata/abfb63a8-5187-46bf-a6f1-5120fcac66b6/30a267ae-05a4-432a-9066-15d14eb6a6e8.xm