Dashboard
The dashboard is the homepage for openITCOCKPIT. The dashboard is the homepage for openITCOCKPIT and consists of only one tab by default.
Adding dashboards
To add new tabs, click on the + symbol in the upper right-hand corner of the dashboard.
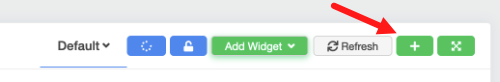
This will open the following window:
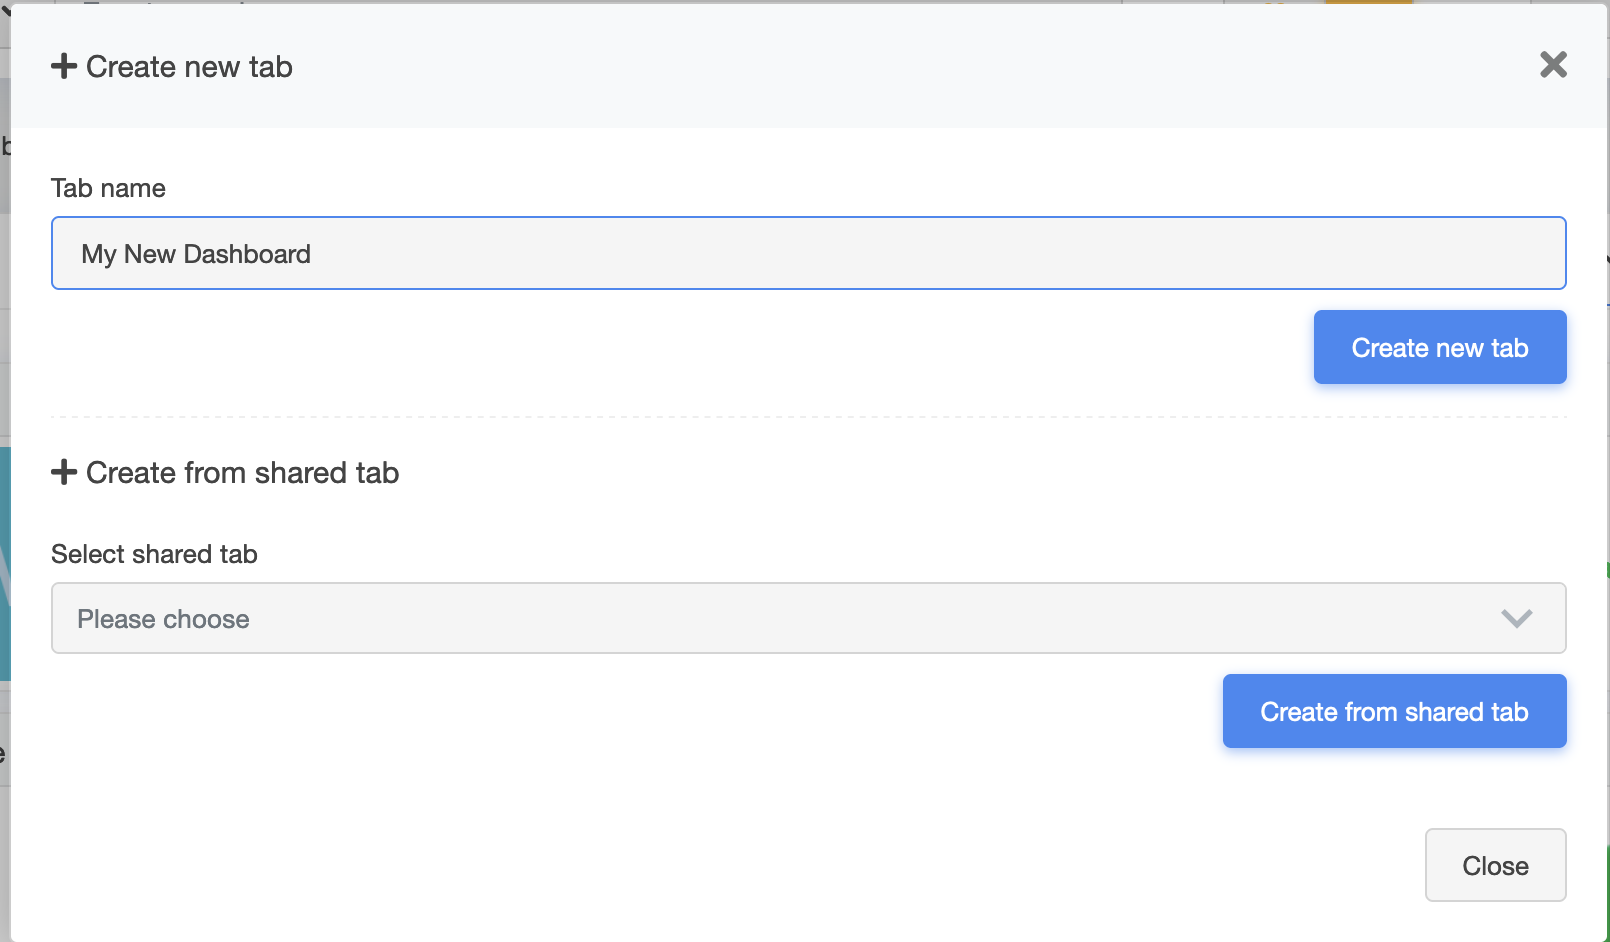
To create an empty, new tab, enter a name for the tab at the top and then click on the Create new tab button.
To create a tab from a template, select a shared tab from the list and then click Create from shared tab..
If you create a tab from a template and something about the template is then changed, the following dialog will appear when you next access the tab.
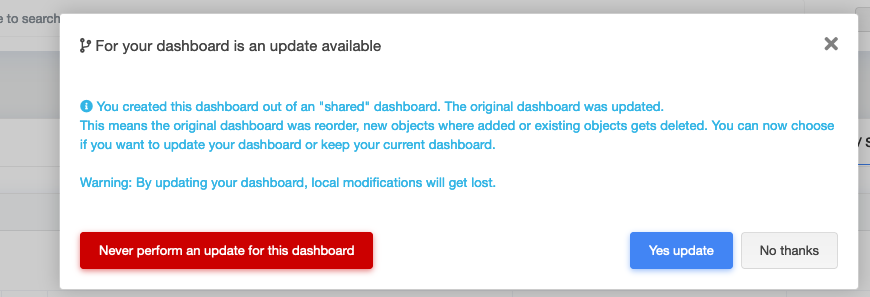
You can now choose whether you want to update your tab or not.
Sharing dashboards
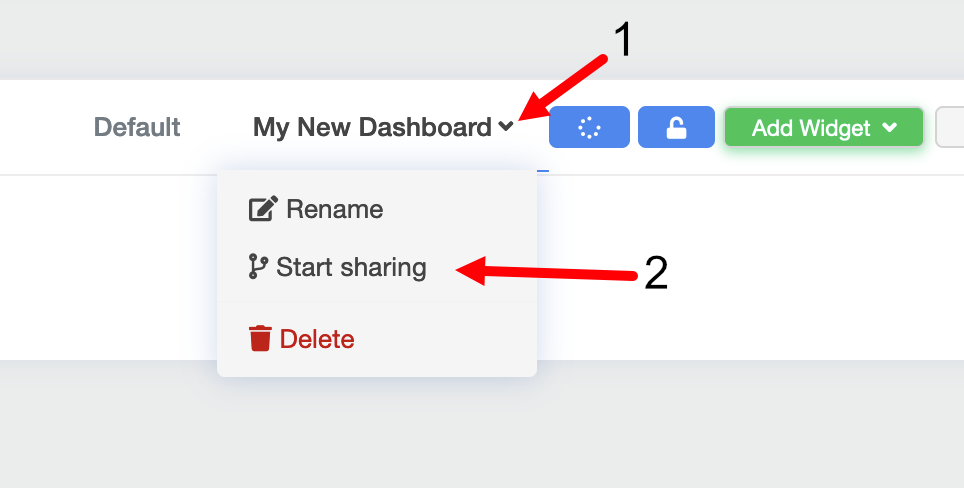
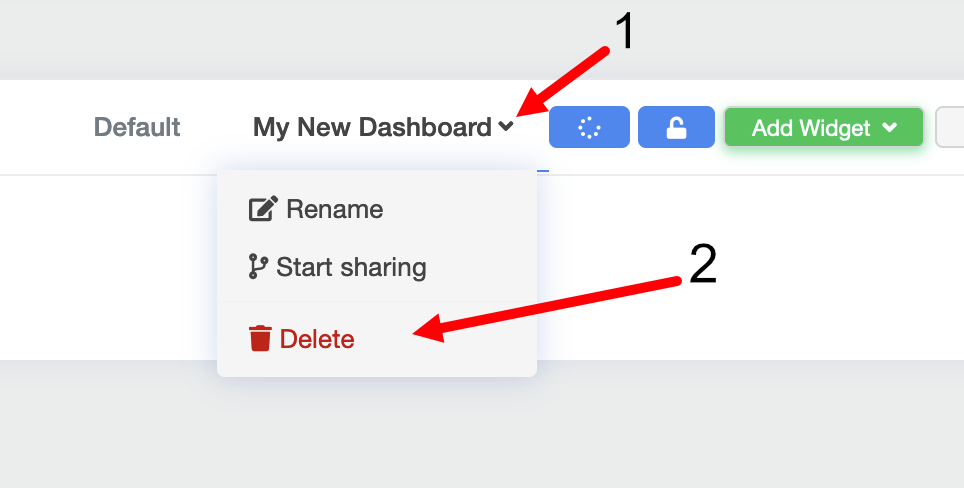
In openITCOCKPIT you have the ability to split tabs. To do this, first click on the downward arrow (1) on a dashboard tab and then on Start sharing.
The shared dashboards will then be available to other users in openITCOCKPIT.
If a dashboard is already shared, the selection list will show the option Stop sharing. This can be used to stop sharing the dashboard tab again.
Dashboard rotation
The dashboard rotation feature makes all existing dashboard tabs be displayed one after the other at a user-defined interval of between 10 seconds and 15 minutes.
When used with full-screen mode for dashboards, this can be useful for displaying openITCOCKPIT on a TV, etc.
Deleting dashboards
To delete a dashboard, first click on the downward pointing arrow (1) on a dashboard tab and then on Delete (2).
Adding widgets
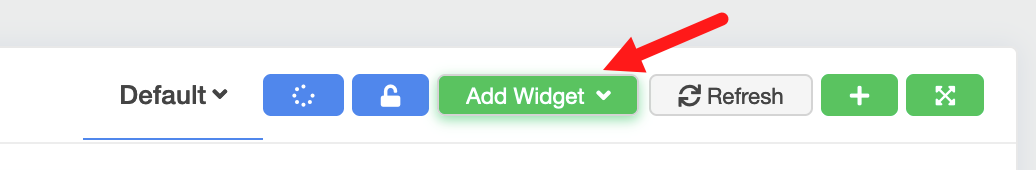
To add a new widget to a dashboard, click the Add widget button.
A list with all available widgets will then appear.
After you have added the corresponding widget, you may need to configure it.
After saving the widget configuration, the widget will be displayed with its content.
Widgets
Welcome
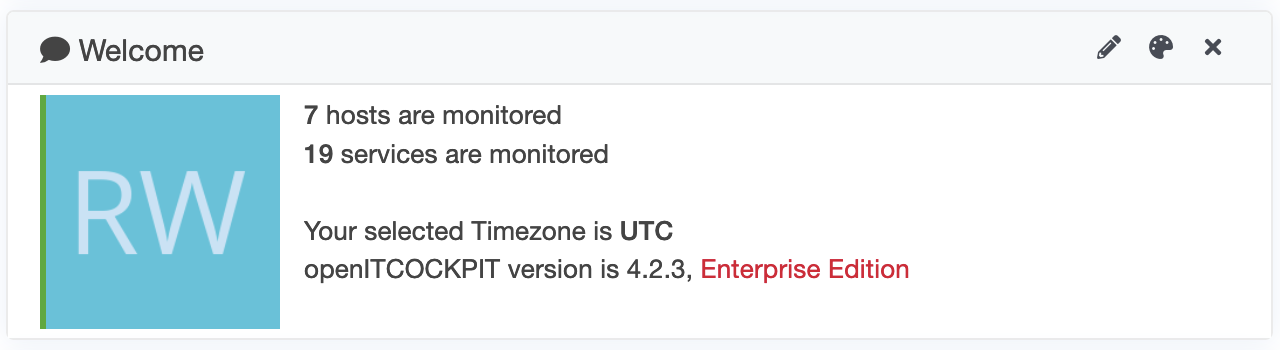
Displays the total number of monitored hosts and services visible to a user. The user time zone, openITCOCKPIT version and edition are also displayed.
Overall failures
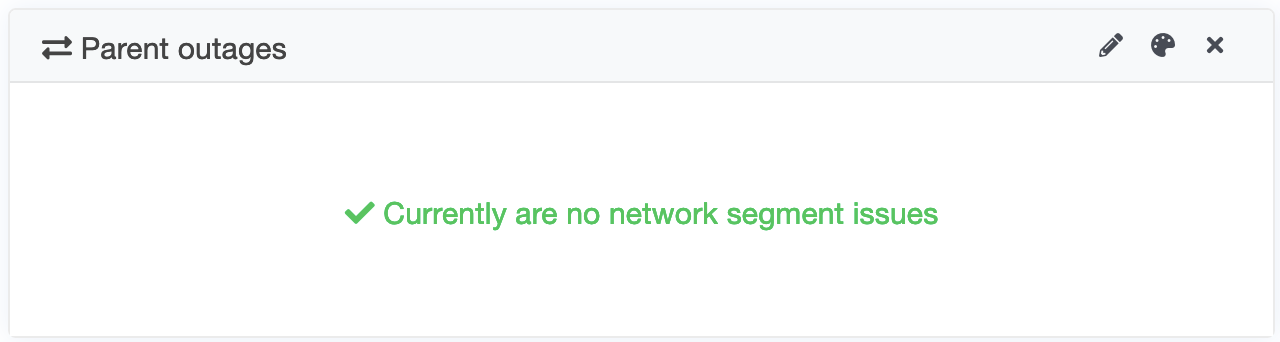
Shows a list of all inaccessible, linked parent objects.
Host/service pie chart (180)
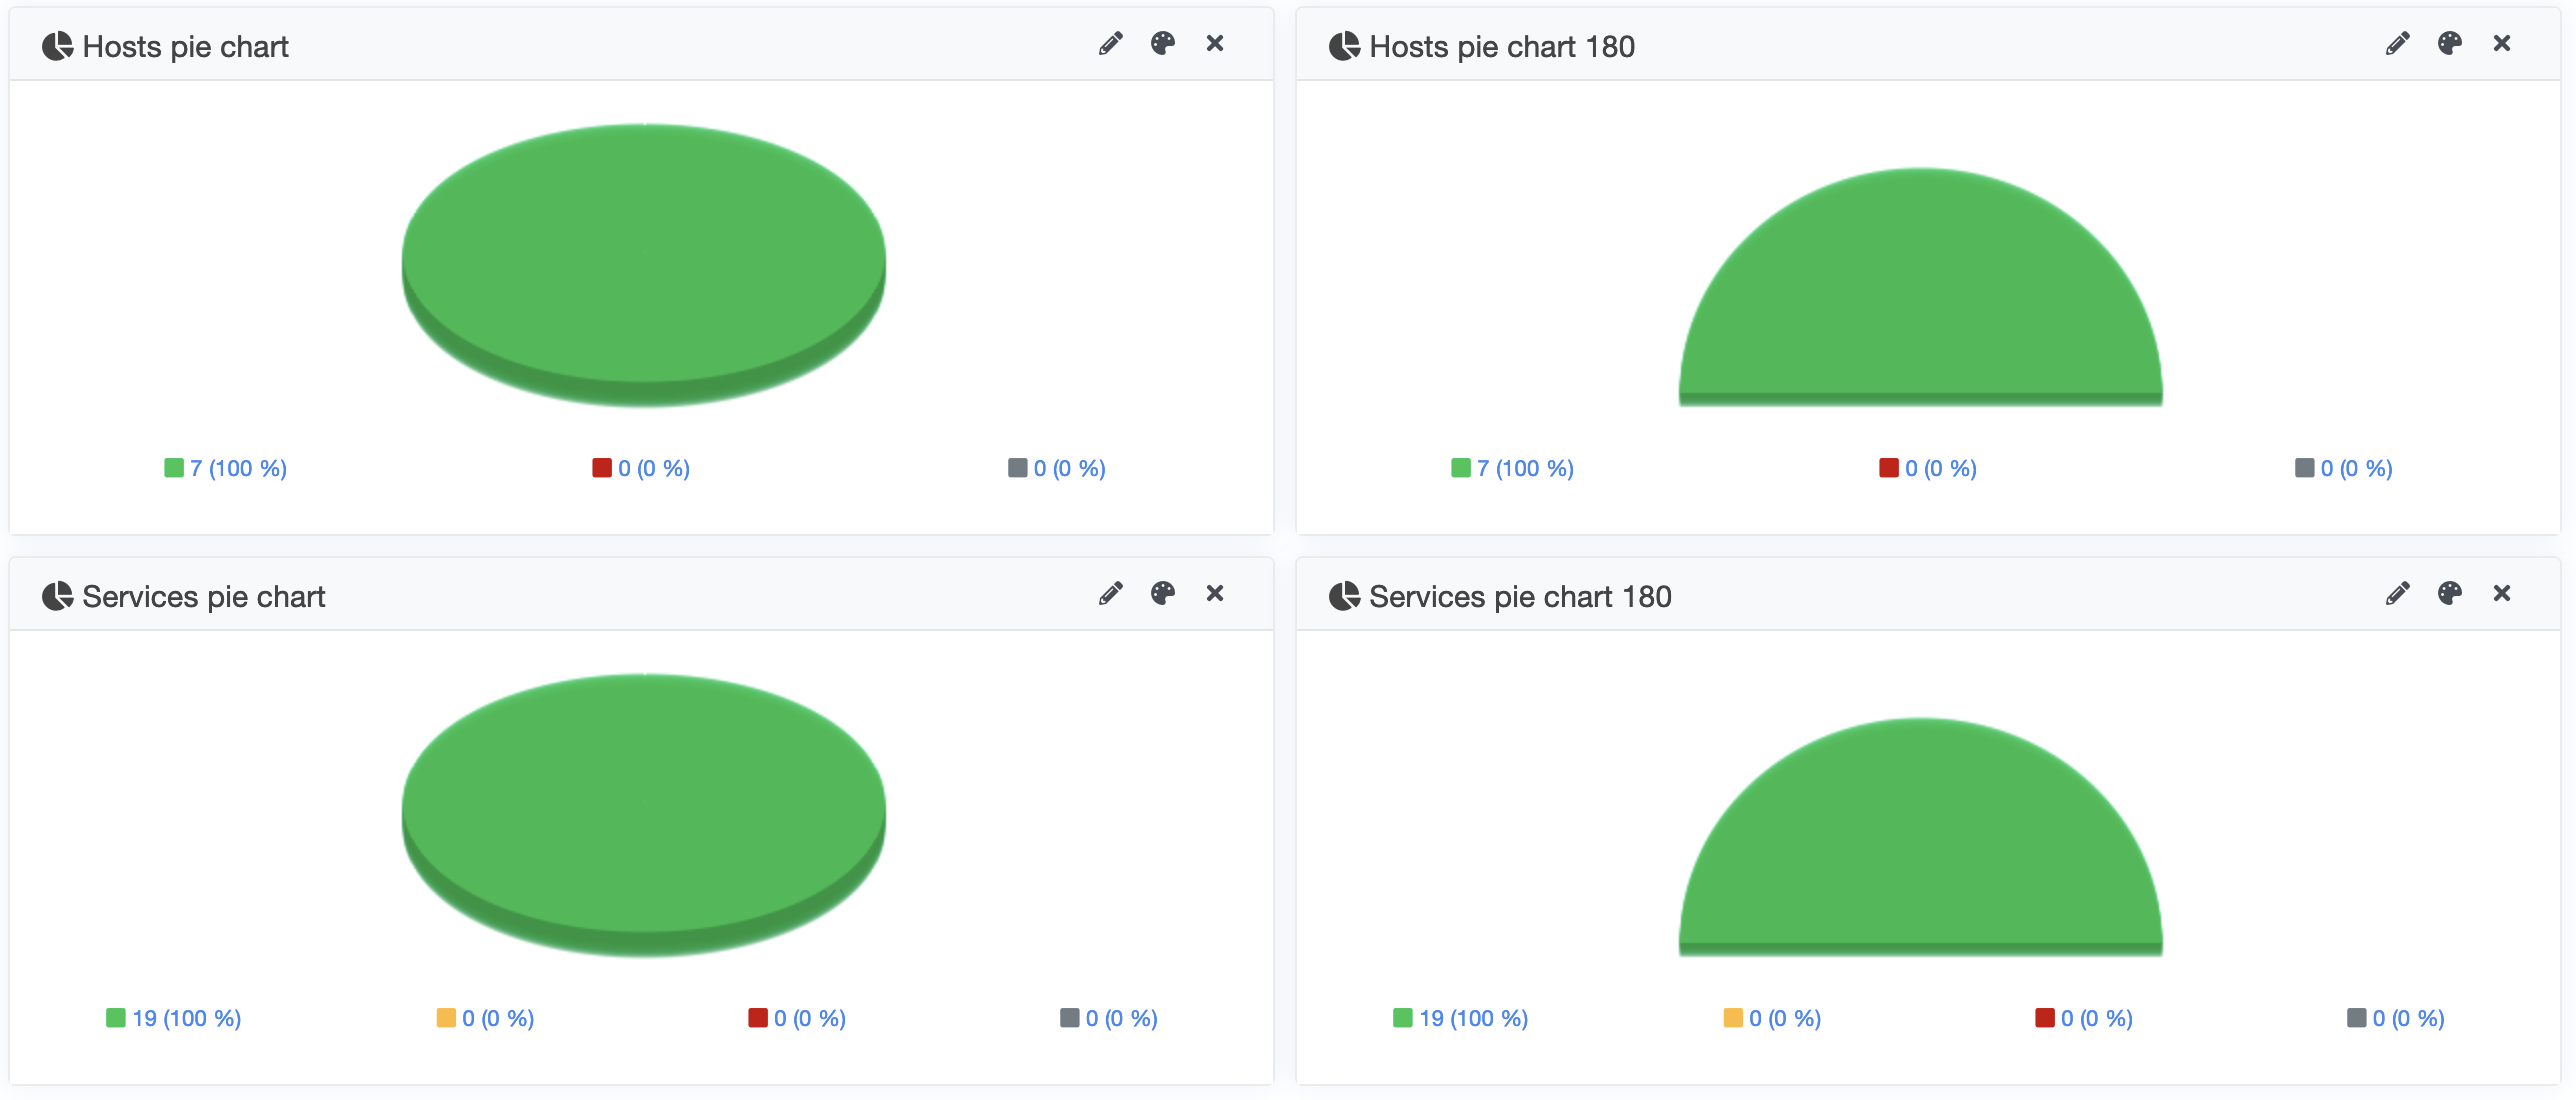
Depending on the option selected, this shows half or full pie charts of all hosts or services and their statuses. Clicking on the status colour below the diagram will open a list displaying the hosts or services in the status selected.
Traffic light
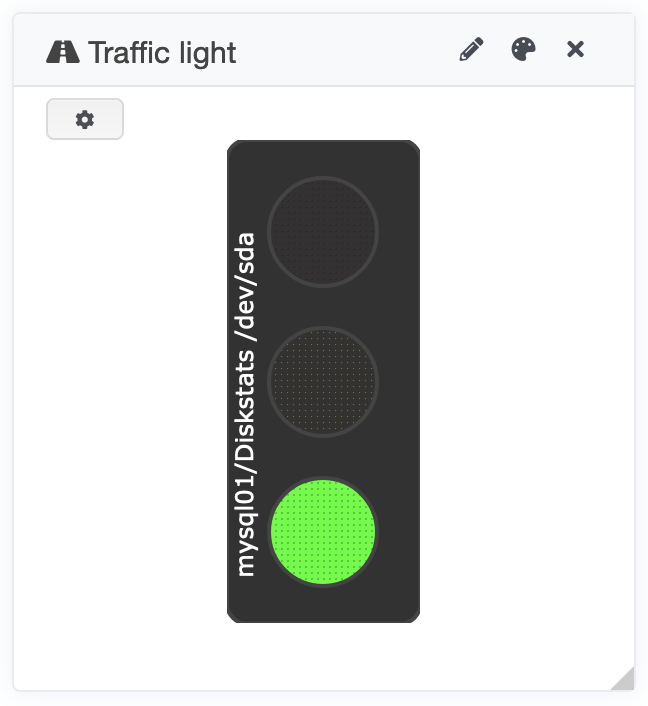
Displays the status colour for a service
Configuration
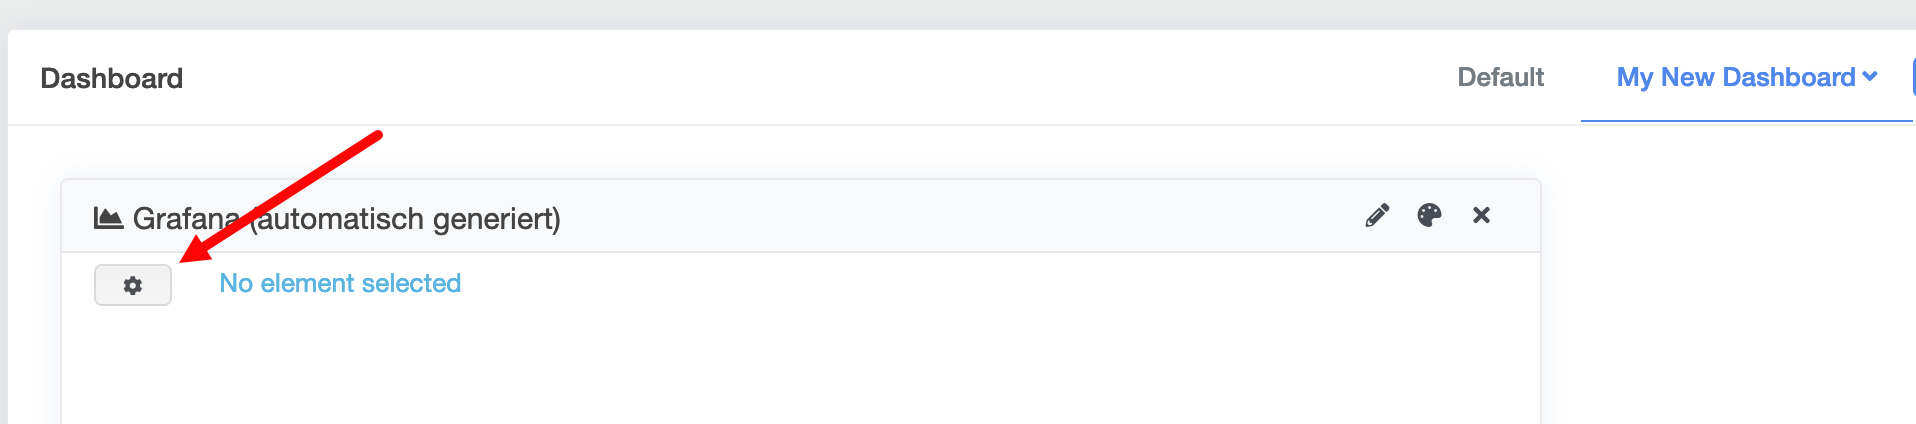
A service must be selected for its status to be displayed. The widget configuration interface can be accessed via the gear symbol in the upper right area of the widget.
Speedometer widget
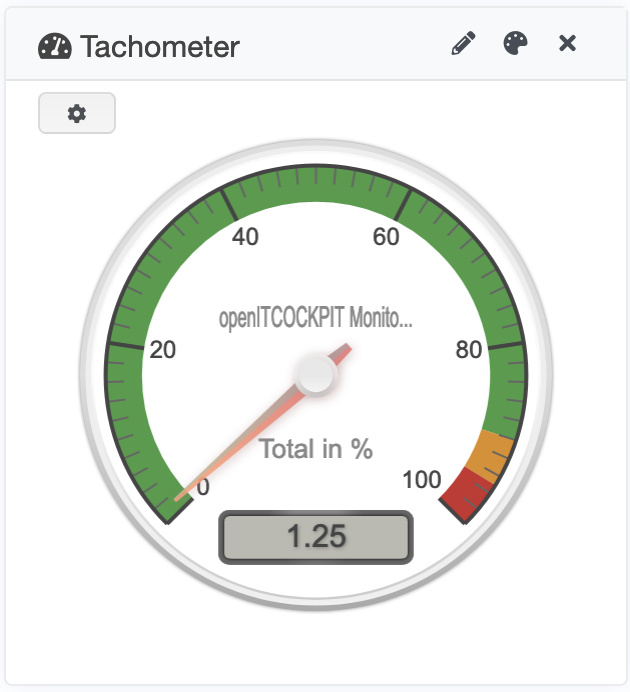
Displays the value of a performance data record for a service. Threshold values are additionally marked in colour.
Configuration
A service as well as a performance data set must be selected. The widget configuration interface can be accessed via the gear symbol in the upper right area of the widget.
Notice
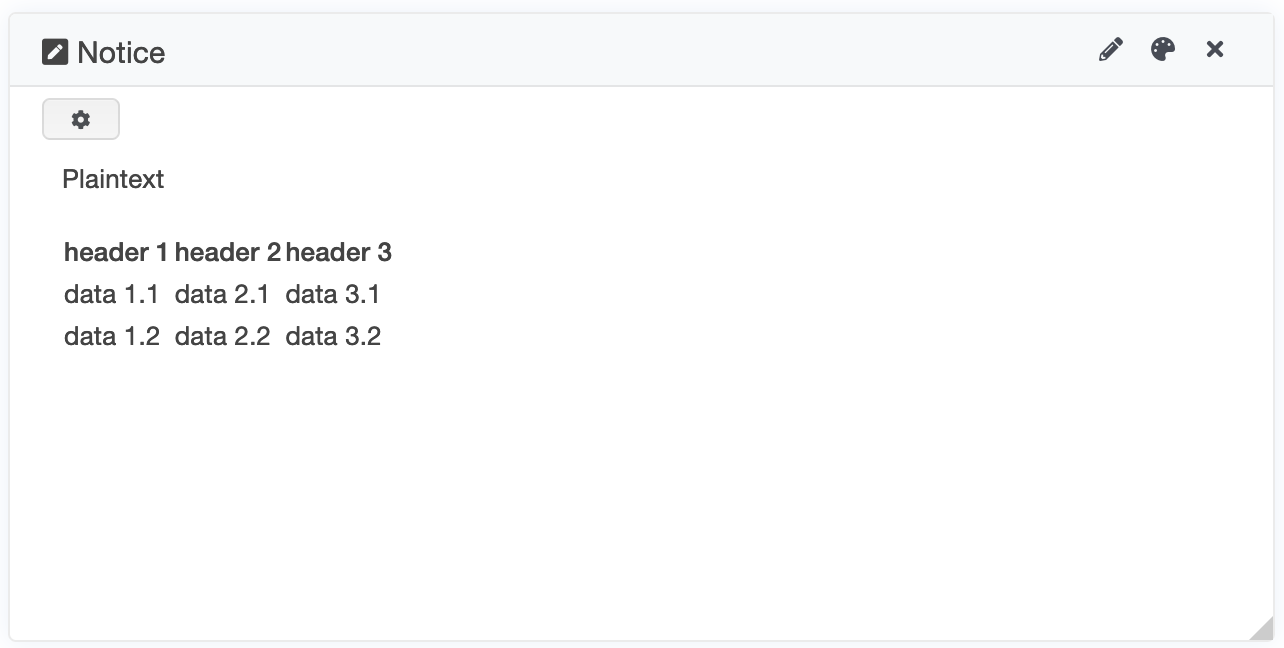
The notice widget can display text, HTML or Markdown language.
Configuration
Text, HTML or Markdown can be inserted into the text field. The widget configuration interface can be accessed via the gear symbol in the upper right area of the widget.
Host/service in maintenance
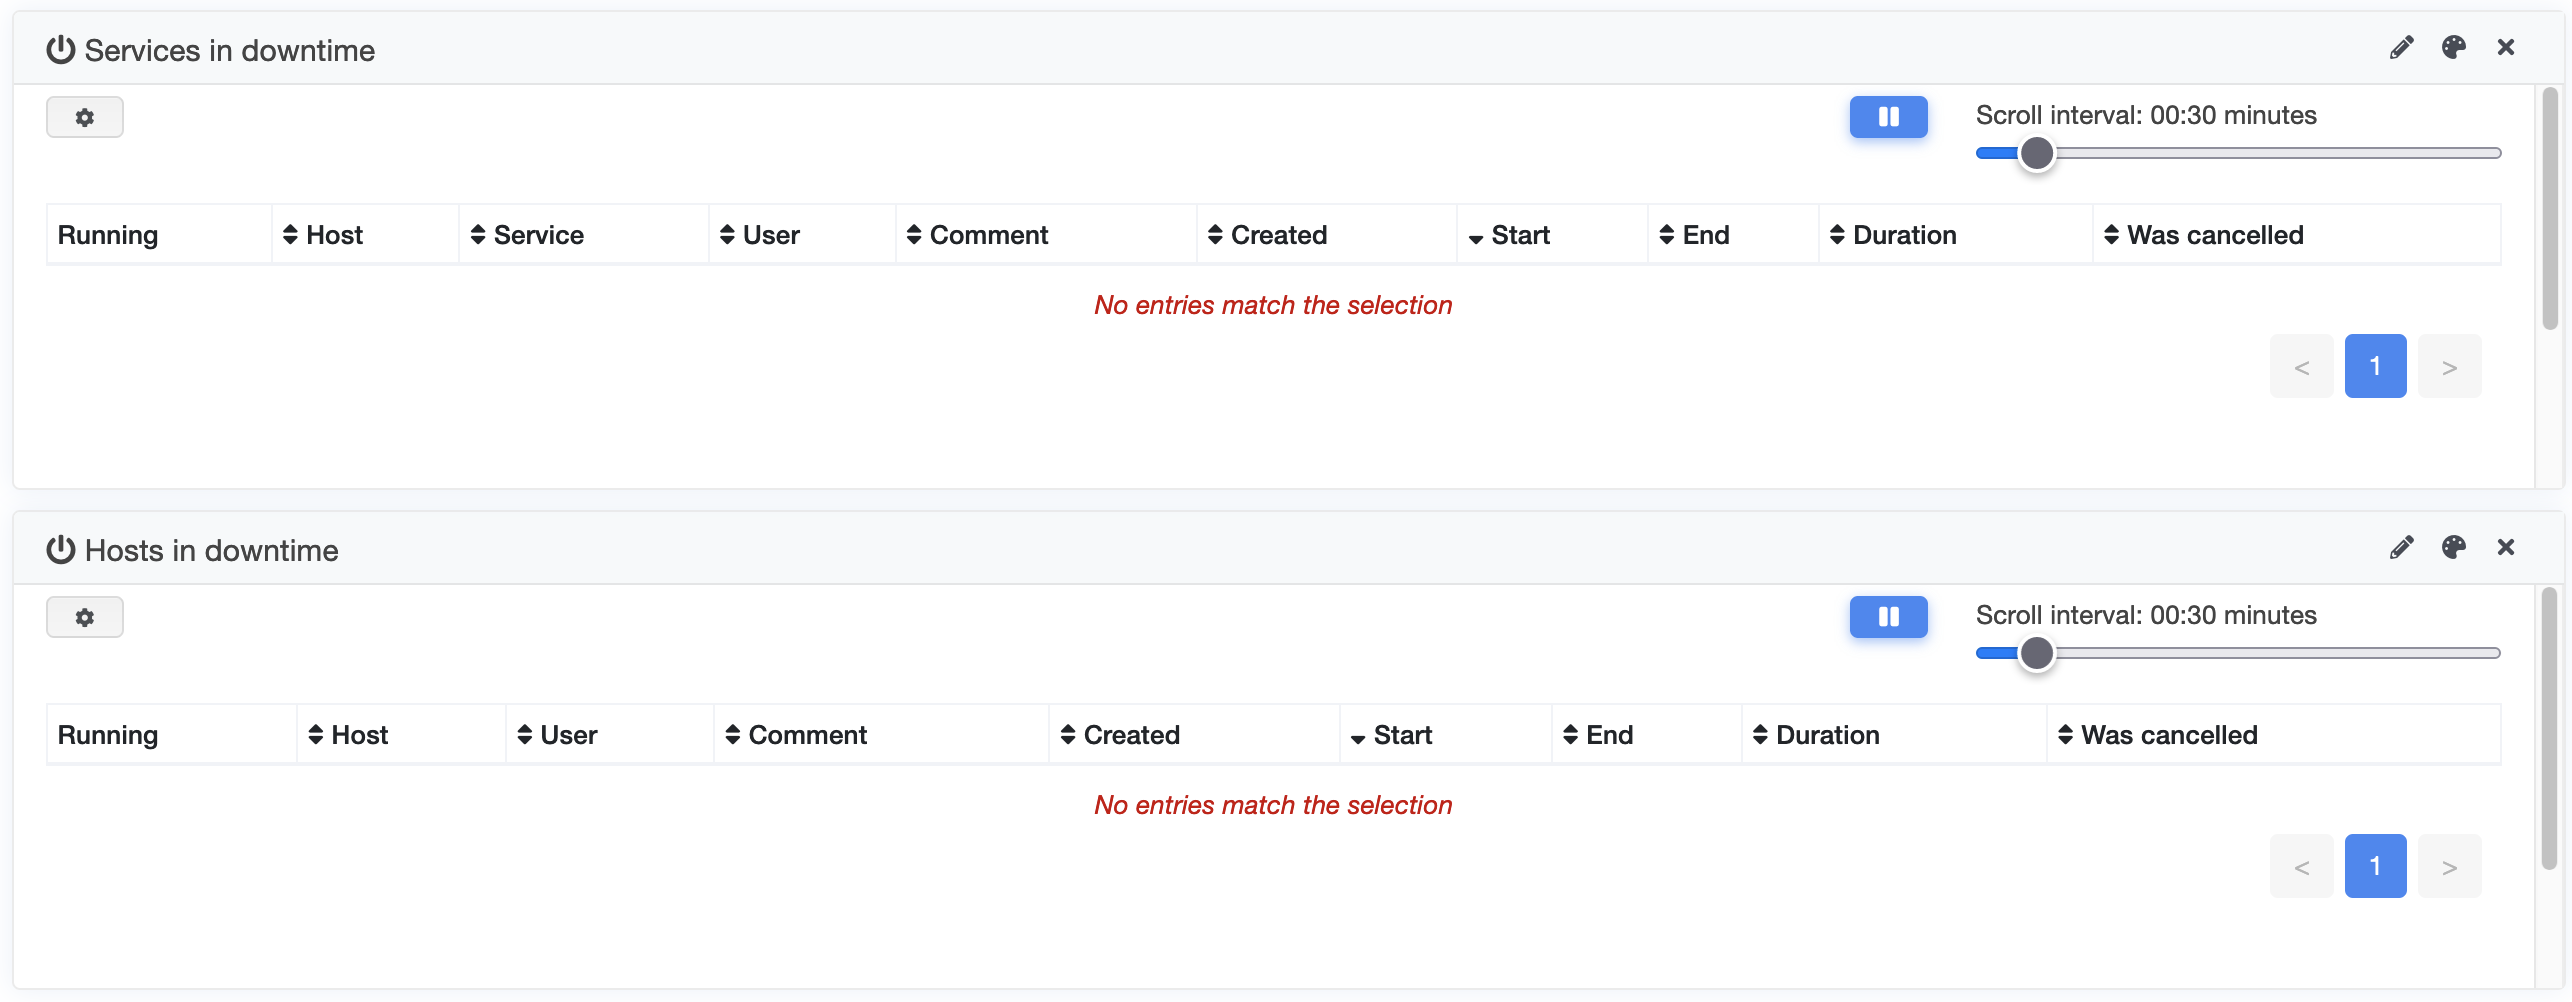
The Host or Service in Maintenance widget displays hosts or services that are down for maintenance.
Configuration
Using the configuration interface, this can be filtered according to hosts or services and the maintenance comments. The maintenance times can also be hidden or displayed via various options. The widget configuration interface can be accessed via the gear symbol in the upper right area of the widget.
Host status/service status list
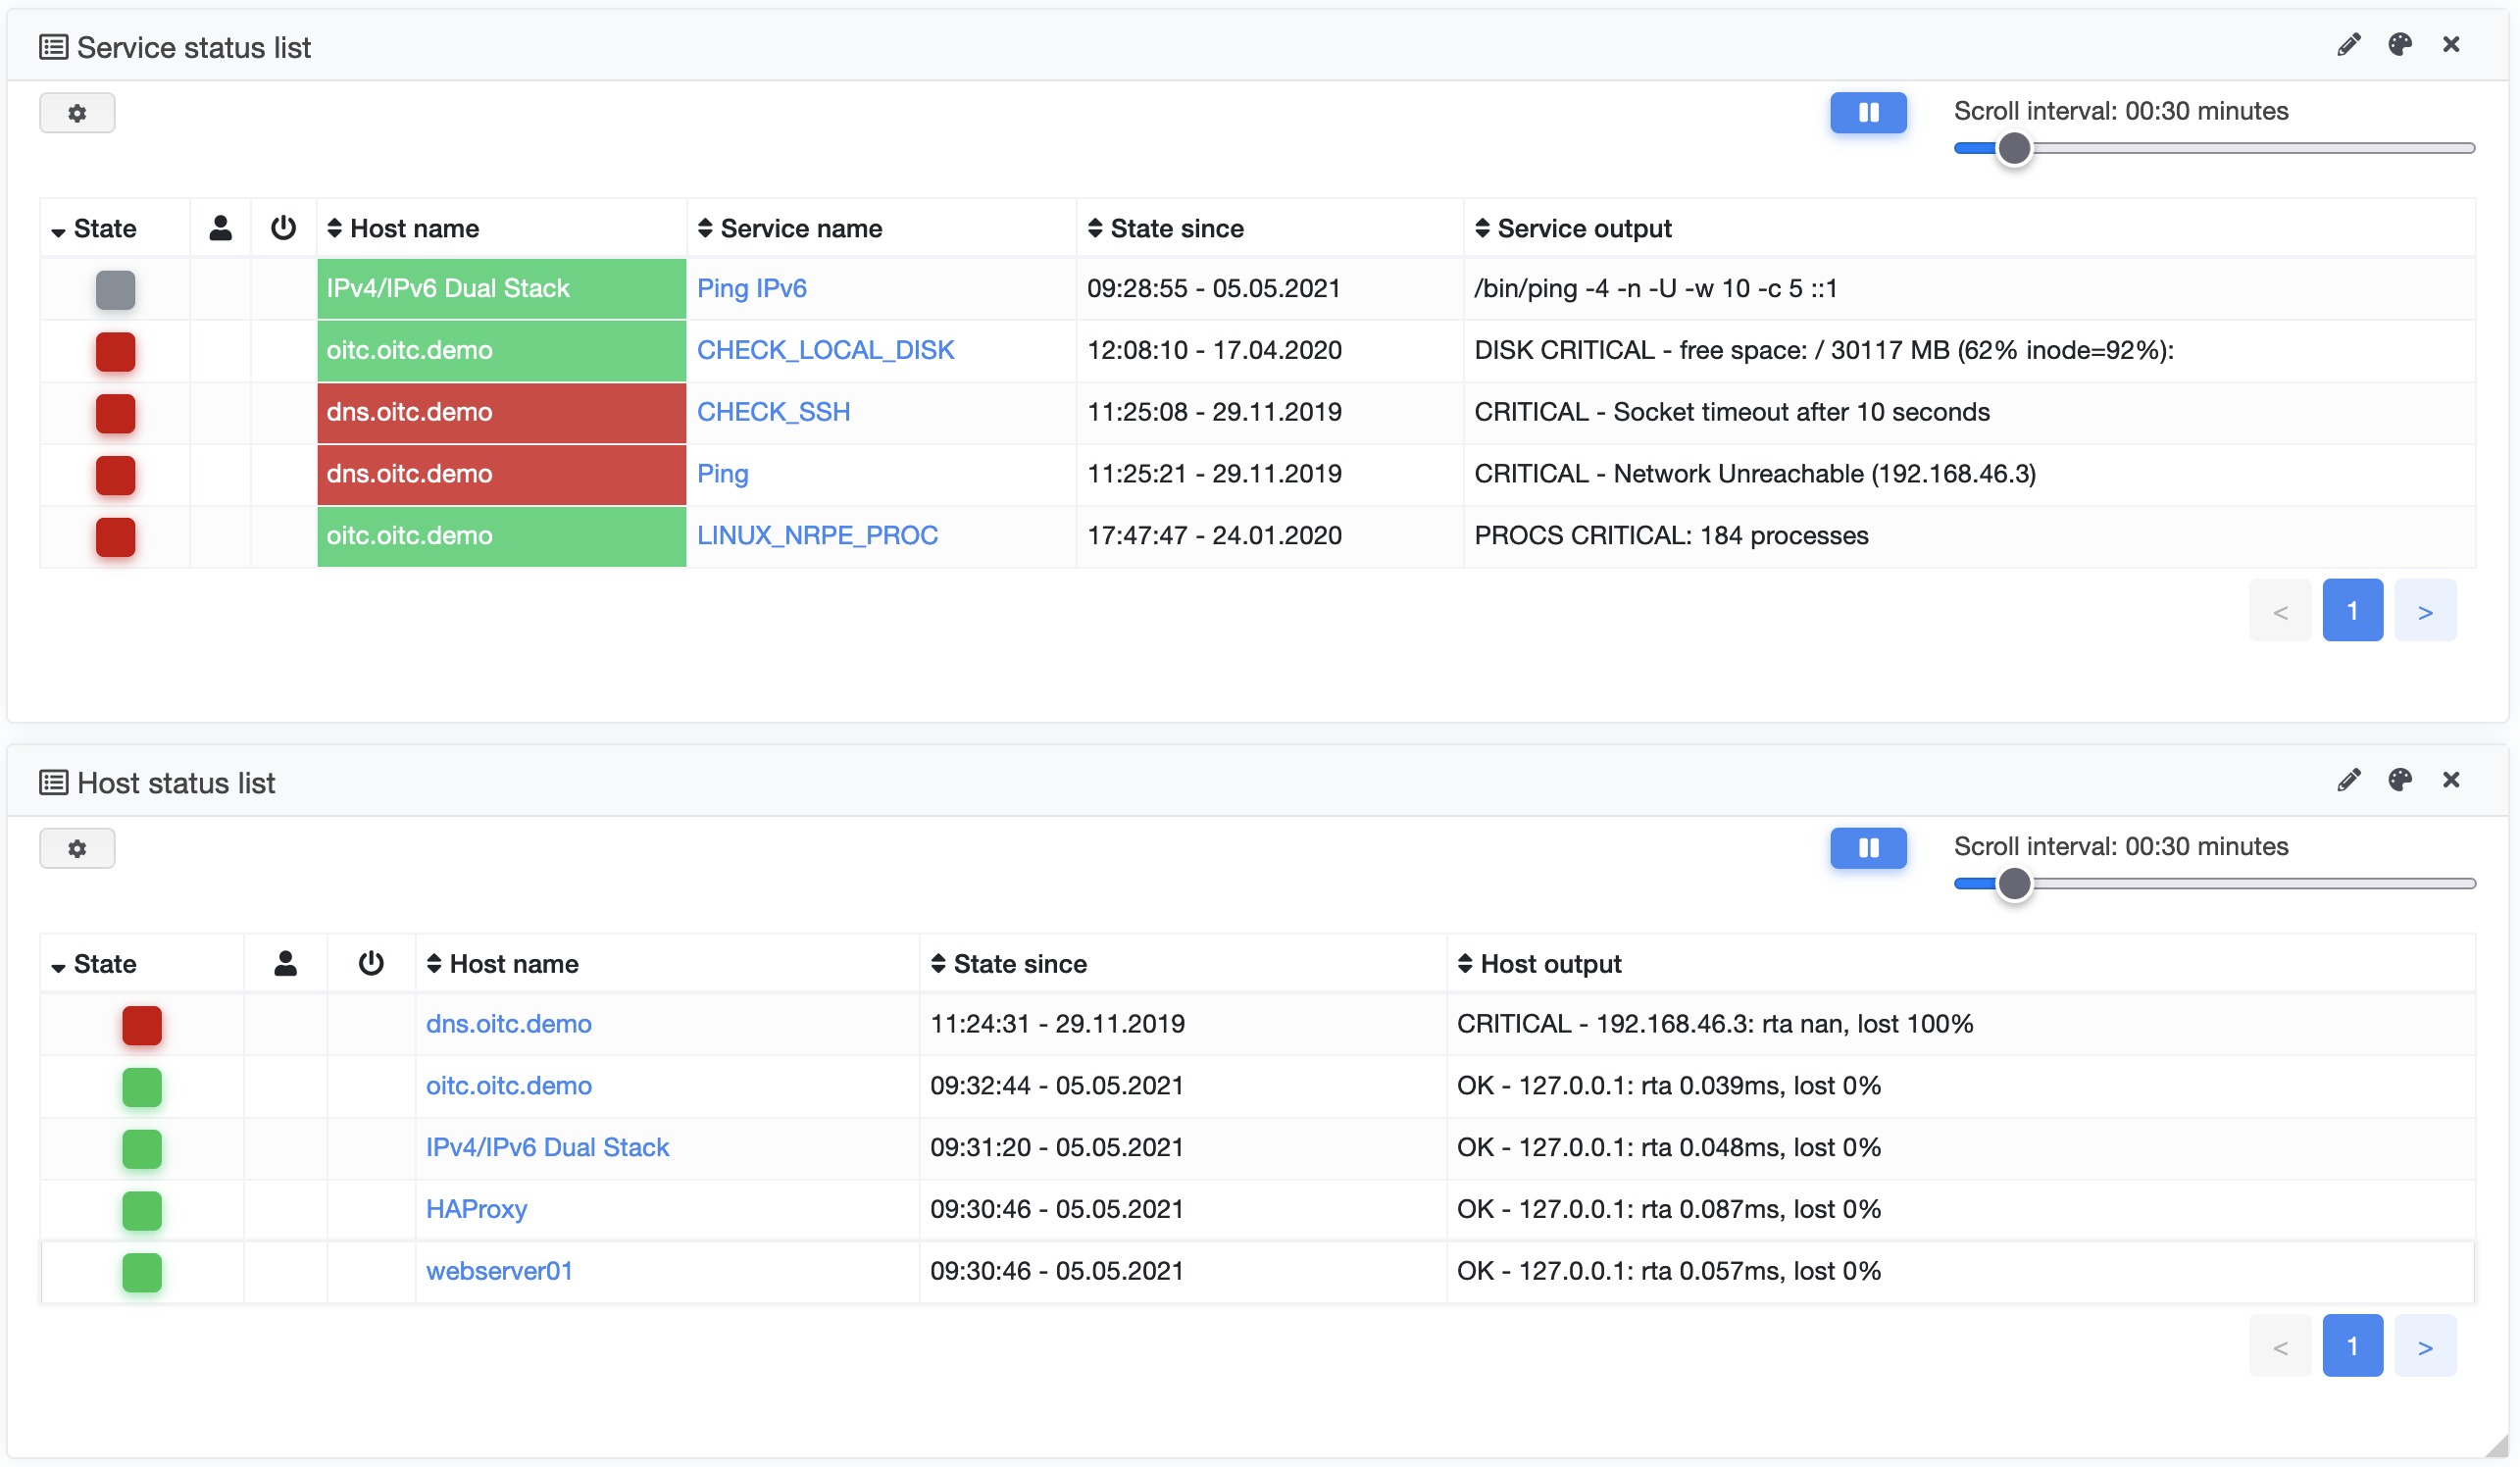
Displays a filterable list of hosts or services. These lists contain the status, current maintenance times, acknowledgements, the time the status occurred as well as the host or service output. The list can scroll automatically at a user-defined interval.
Configuration
Host or service status lists can be filtered by host name or host and service name as well as by output. In addition, various options are available, for example for filtering by status, maintenance times or status confirmations. The widget configuration interface can be accessed via the gear symbol in the upper right area of the widget.
Host status/service status overview
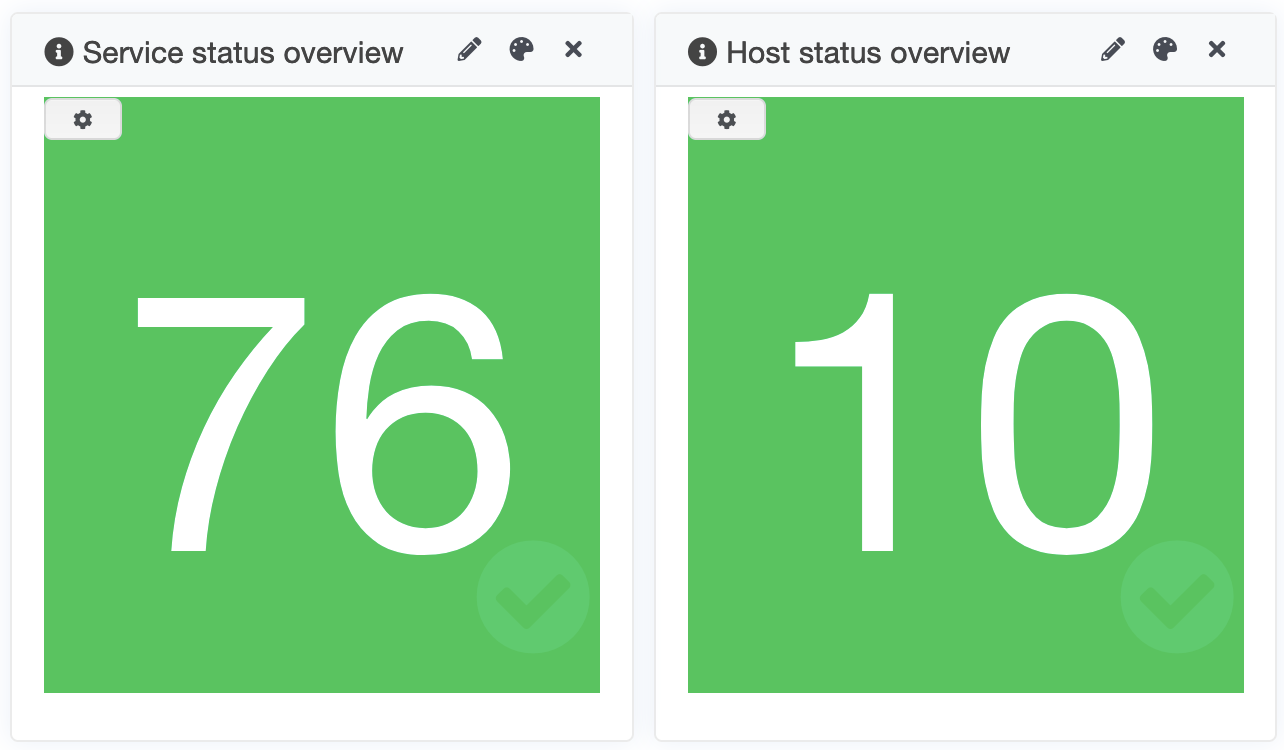
The host or service status overview widget shows the number of hosts or services in a given status (for example UP/OK).
Configuration
The host or service status overview only shows the number of hosts or services in the selected status. This selection can be made via the widget configuration interface. It is also possible to filter according to the host or host and service name. The widget configuration interface can be accessed via the gear symbol in the upper right area of the widget.
Host/Service Top Alerts

The Host or Service Top Alerts widgets show the notification alerts for the configured status within the retroactively configured time period. It is grouped by number and most recent date. Count here refers to the number of alarms themselves and not the number of notifications sent. So if 20 people have been notified of an alarm, only 1 alarm will be counted. Otherwise, it will distort the display of the actual alarms.
Configuration
The widgets can be configured according to status and the period to be viewed.
Automap
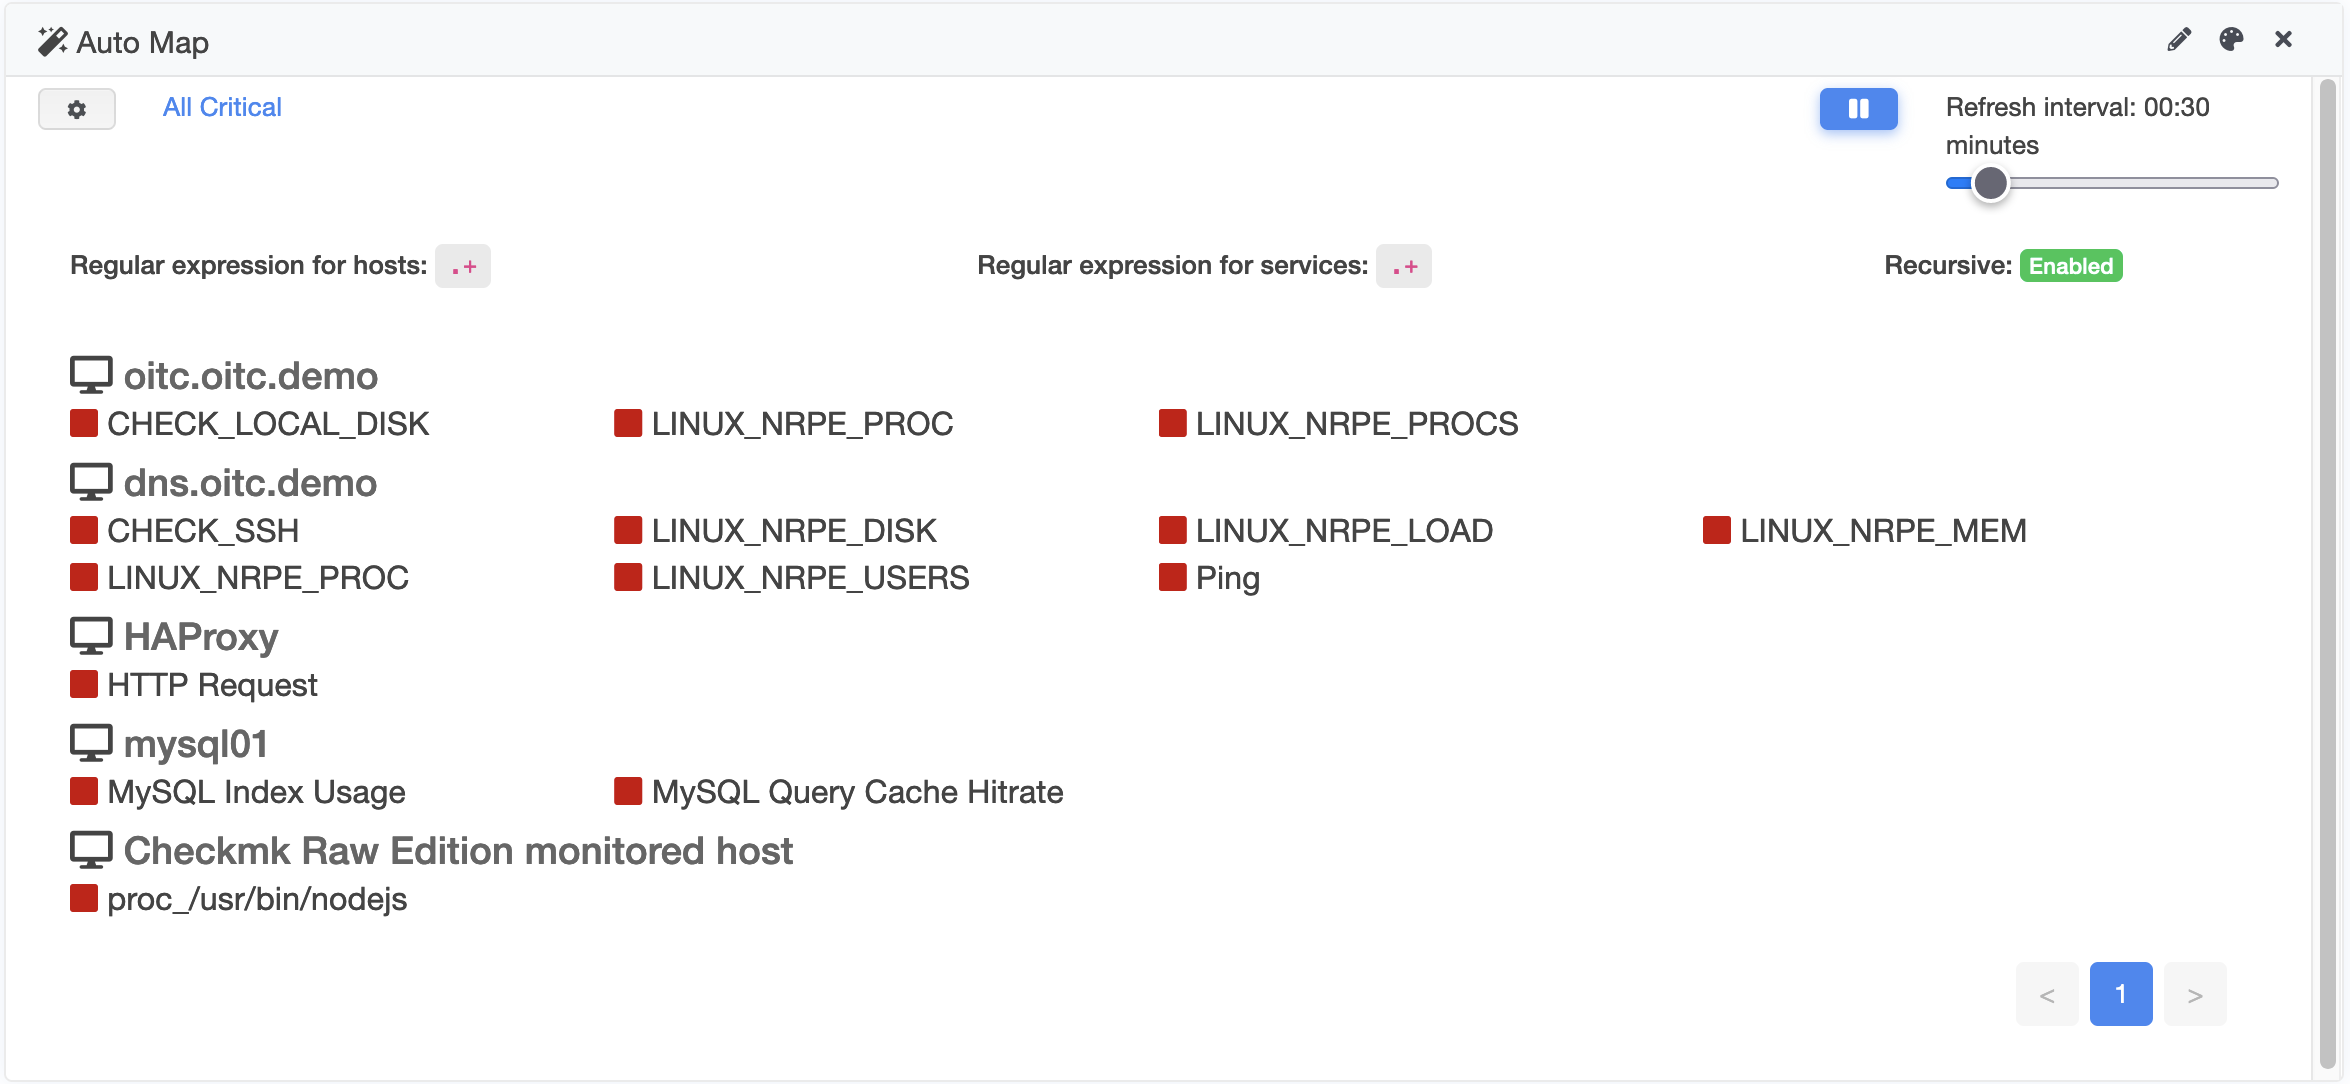
The widget displays the automap an
Configuration
The automap must be created beforehand using the automap function. Once this has been done, a map can be selected in the widget configuration. In addition, you can select how many elements are to be displayed on one page in the widget. The widget configuration interface can be accessed via the gear symbol in the upper right area of the widget.
Autoreport overview
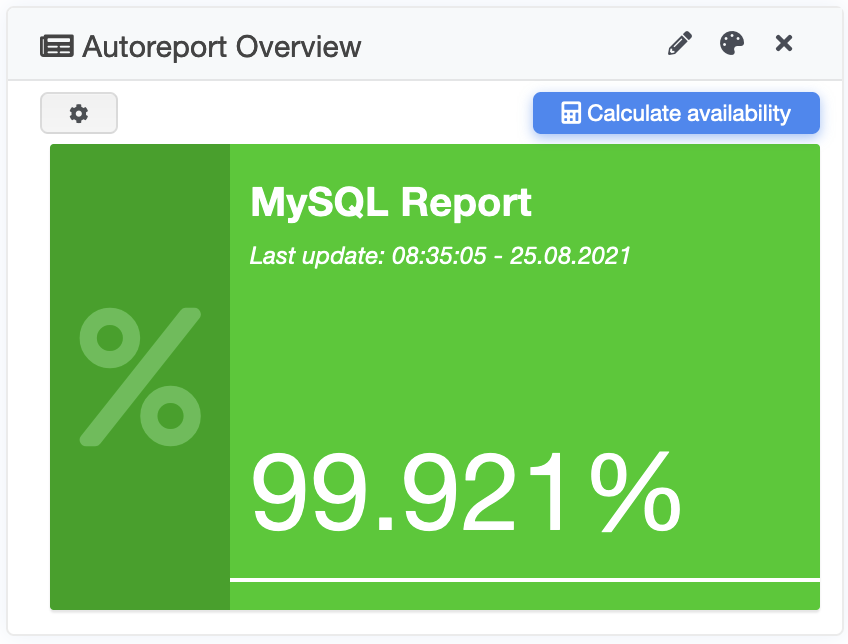
This widget shows an availability indicator for a previously created autoreport an.
Configuration
The widget requires a previously created autoreports. This report can then be selected in the widget's configuration interface. Options for displaying availability, log data and dynamic colouring are also available. The widget configuration interface can be accessed via the gear symbol in the upper right area of the widget.
Grafana (automatically generated)
The widget displays automatically generated Grafana dashboards.
Configuration
Automatically generated Grafana dashboards can be selected via the host name in the widget configuration area. The widget configuration interface can be accessed via the gear symbol in the upper right area of the widget.
Grafana (user-defined)
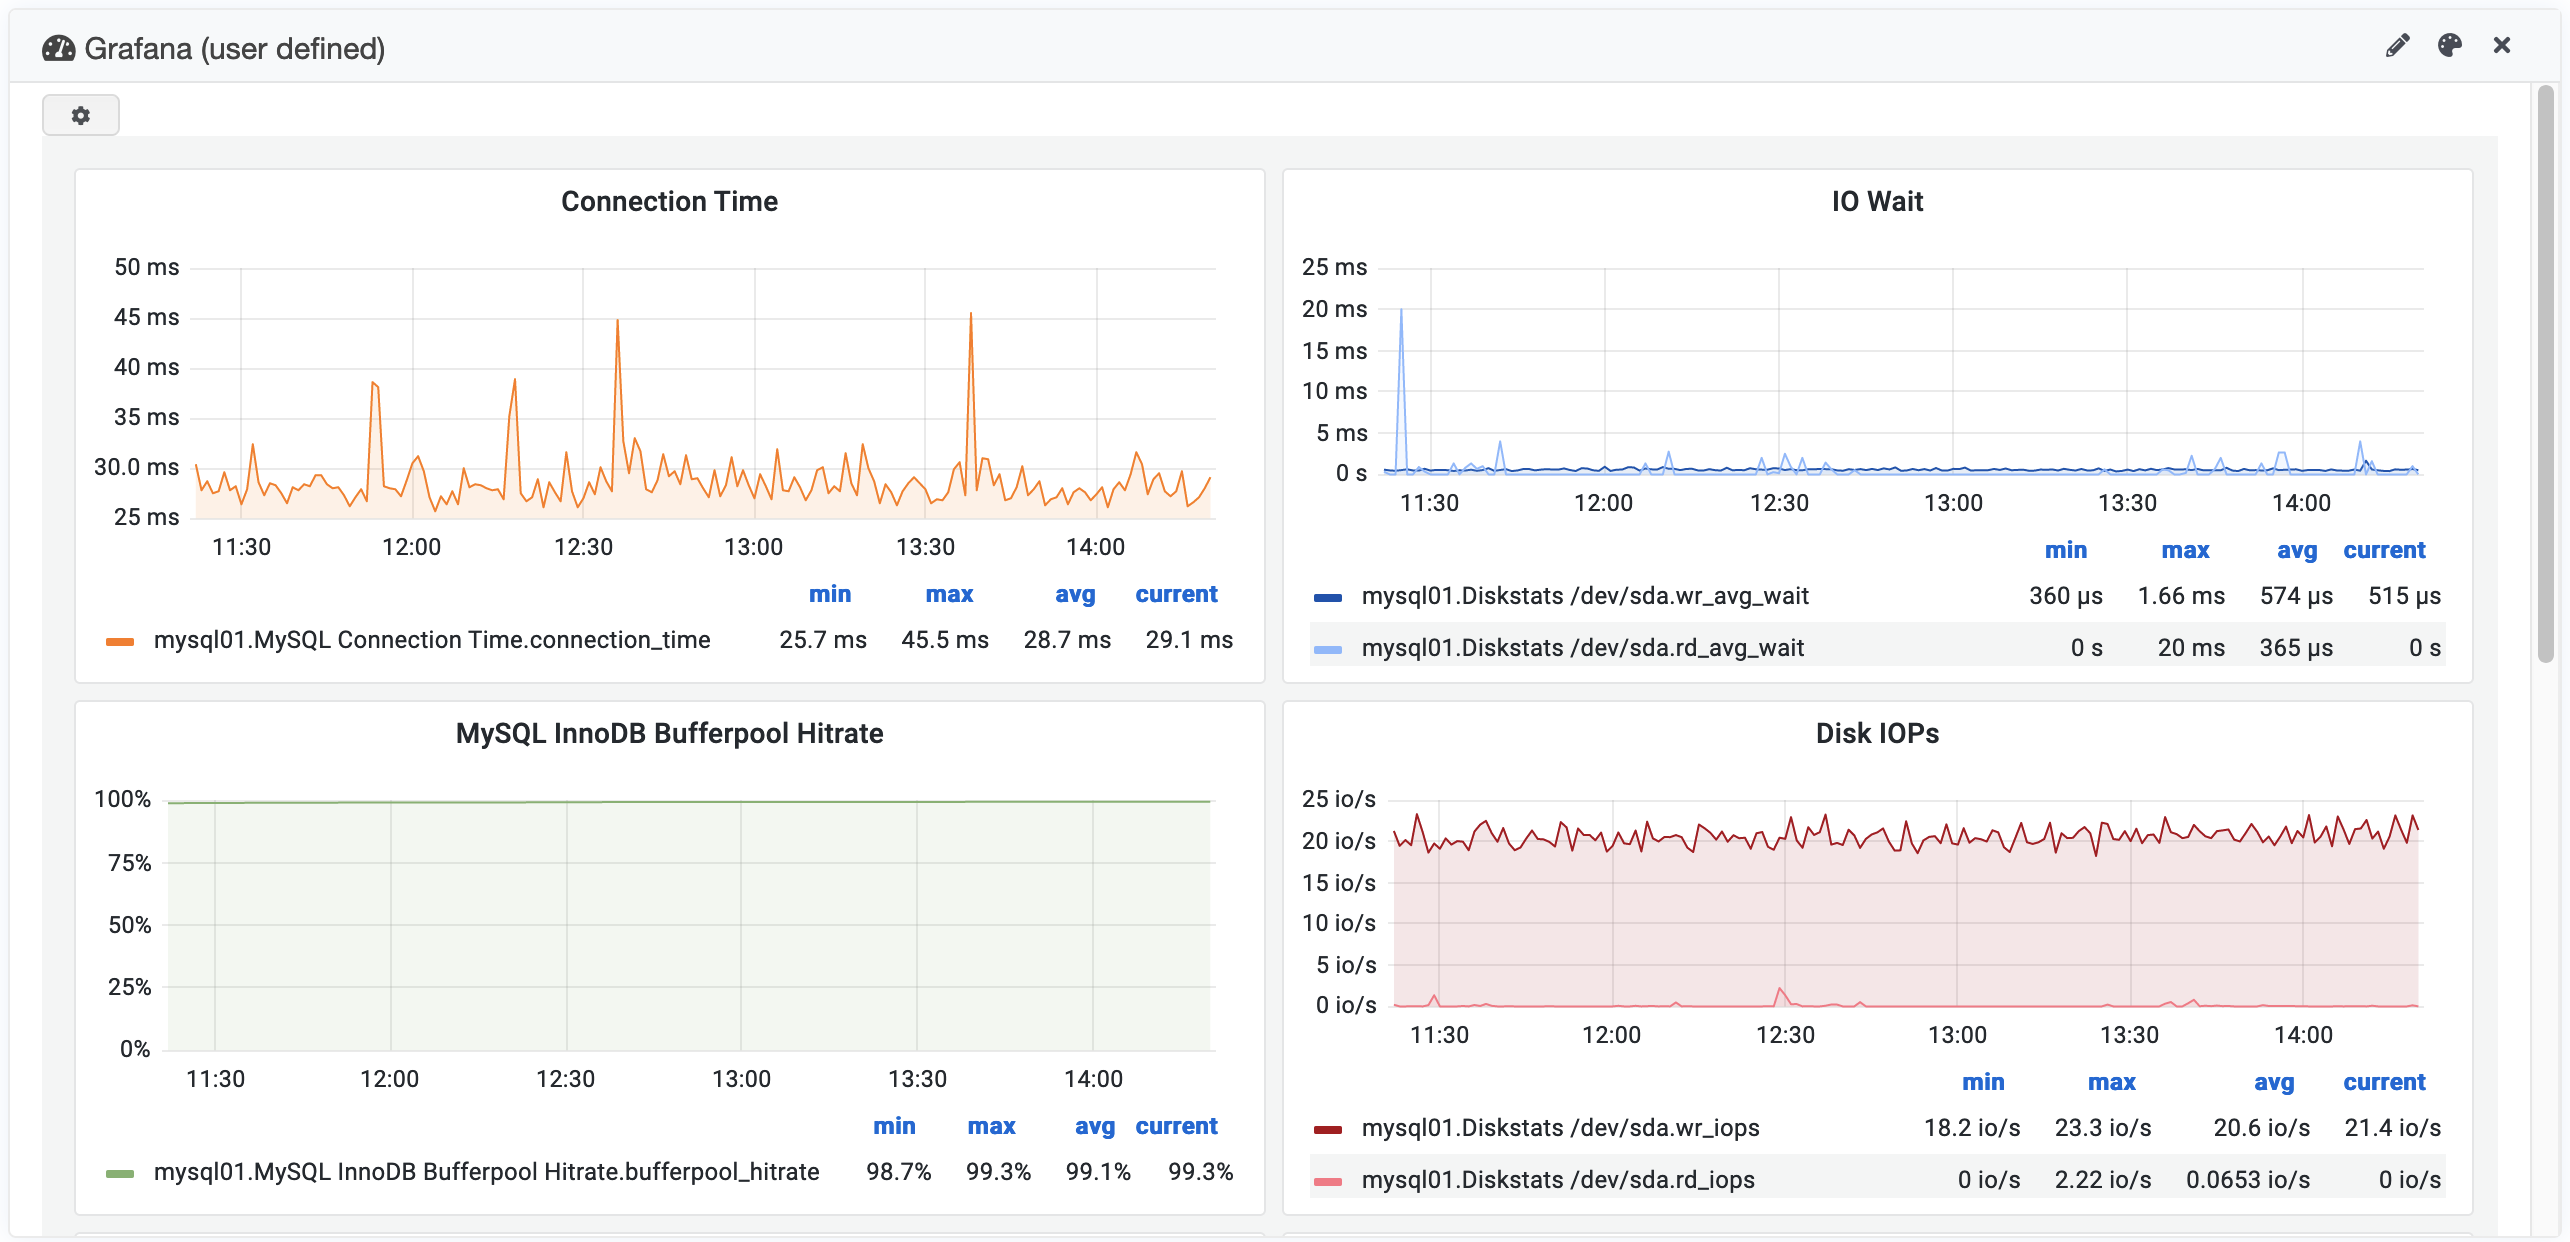
The widget displays custom Grafana dashboards.
Configuration
Custom Grafana dashboards must be created beforehand using the Grafana module. Once this has been done, a dashboard can then be selected via the widget configuration interface. The widget configuration interface can be accessed via the gear symbol in the upper right area of the widget.
Map (MapModule)
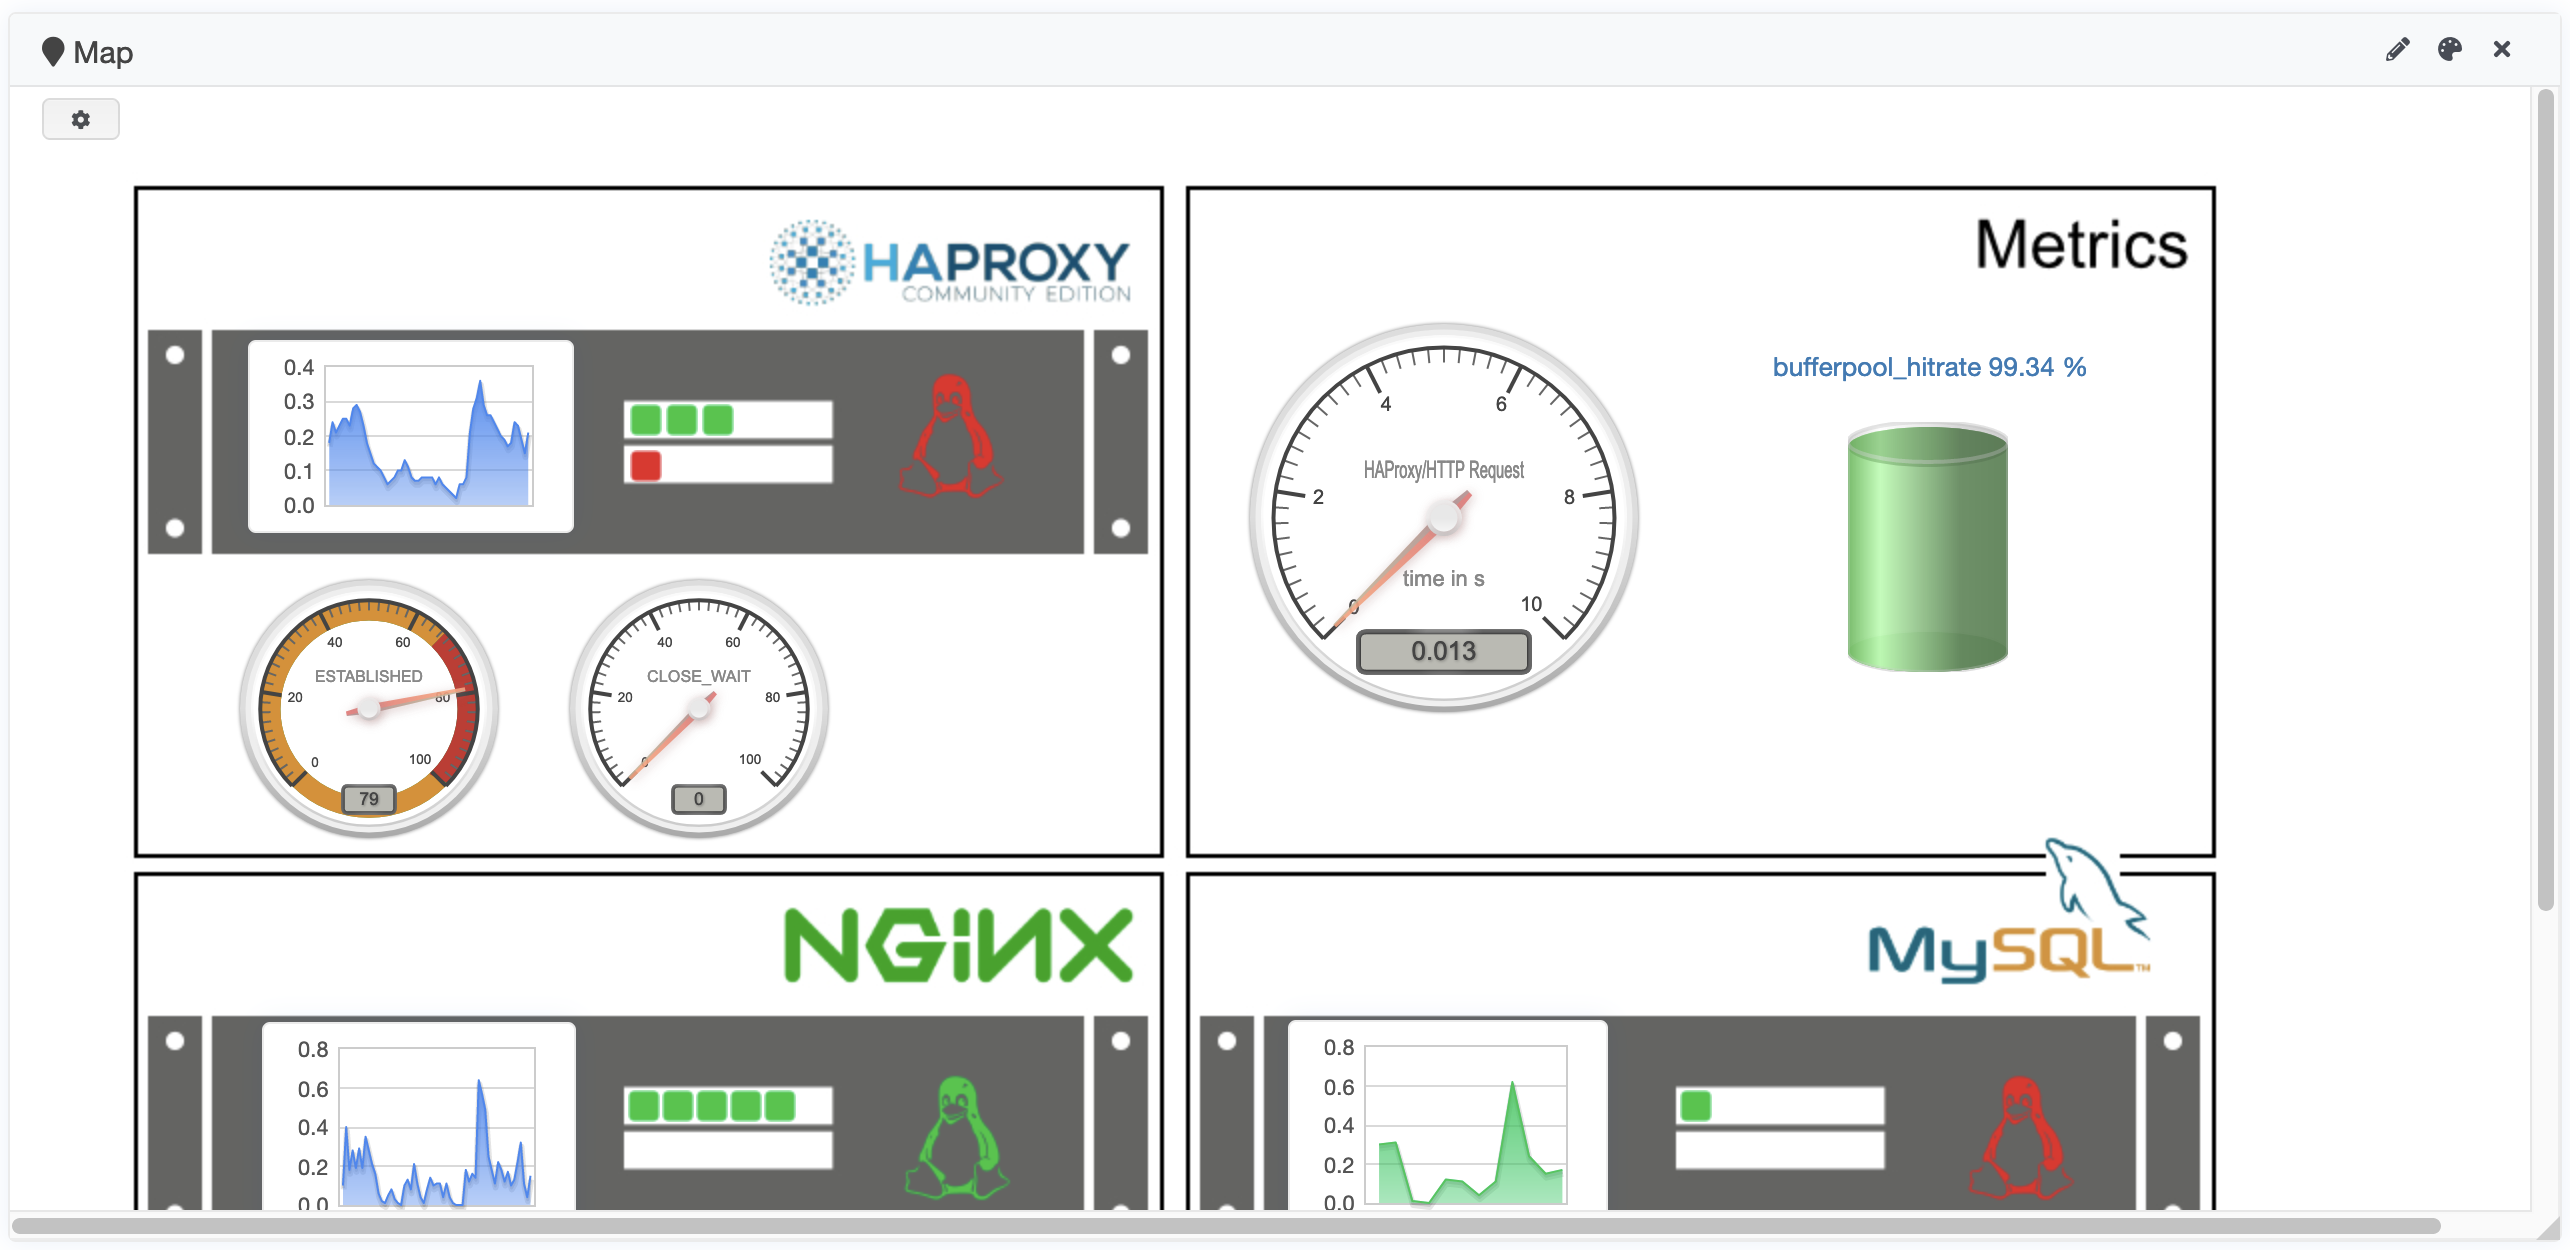
The map widget displays a map created using the MapModule.
Configuration
A map must be created beforehand using the MapModule The map can then be selected using the widget configuration interface. The widget configuration interface can be accessed via the gear symbol in the upper right area of the widget.
Event correlation
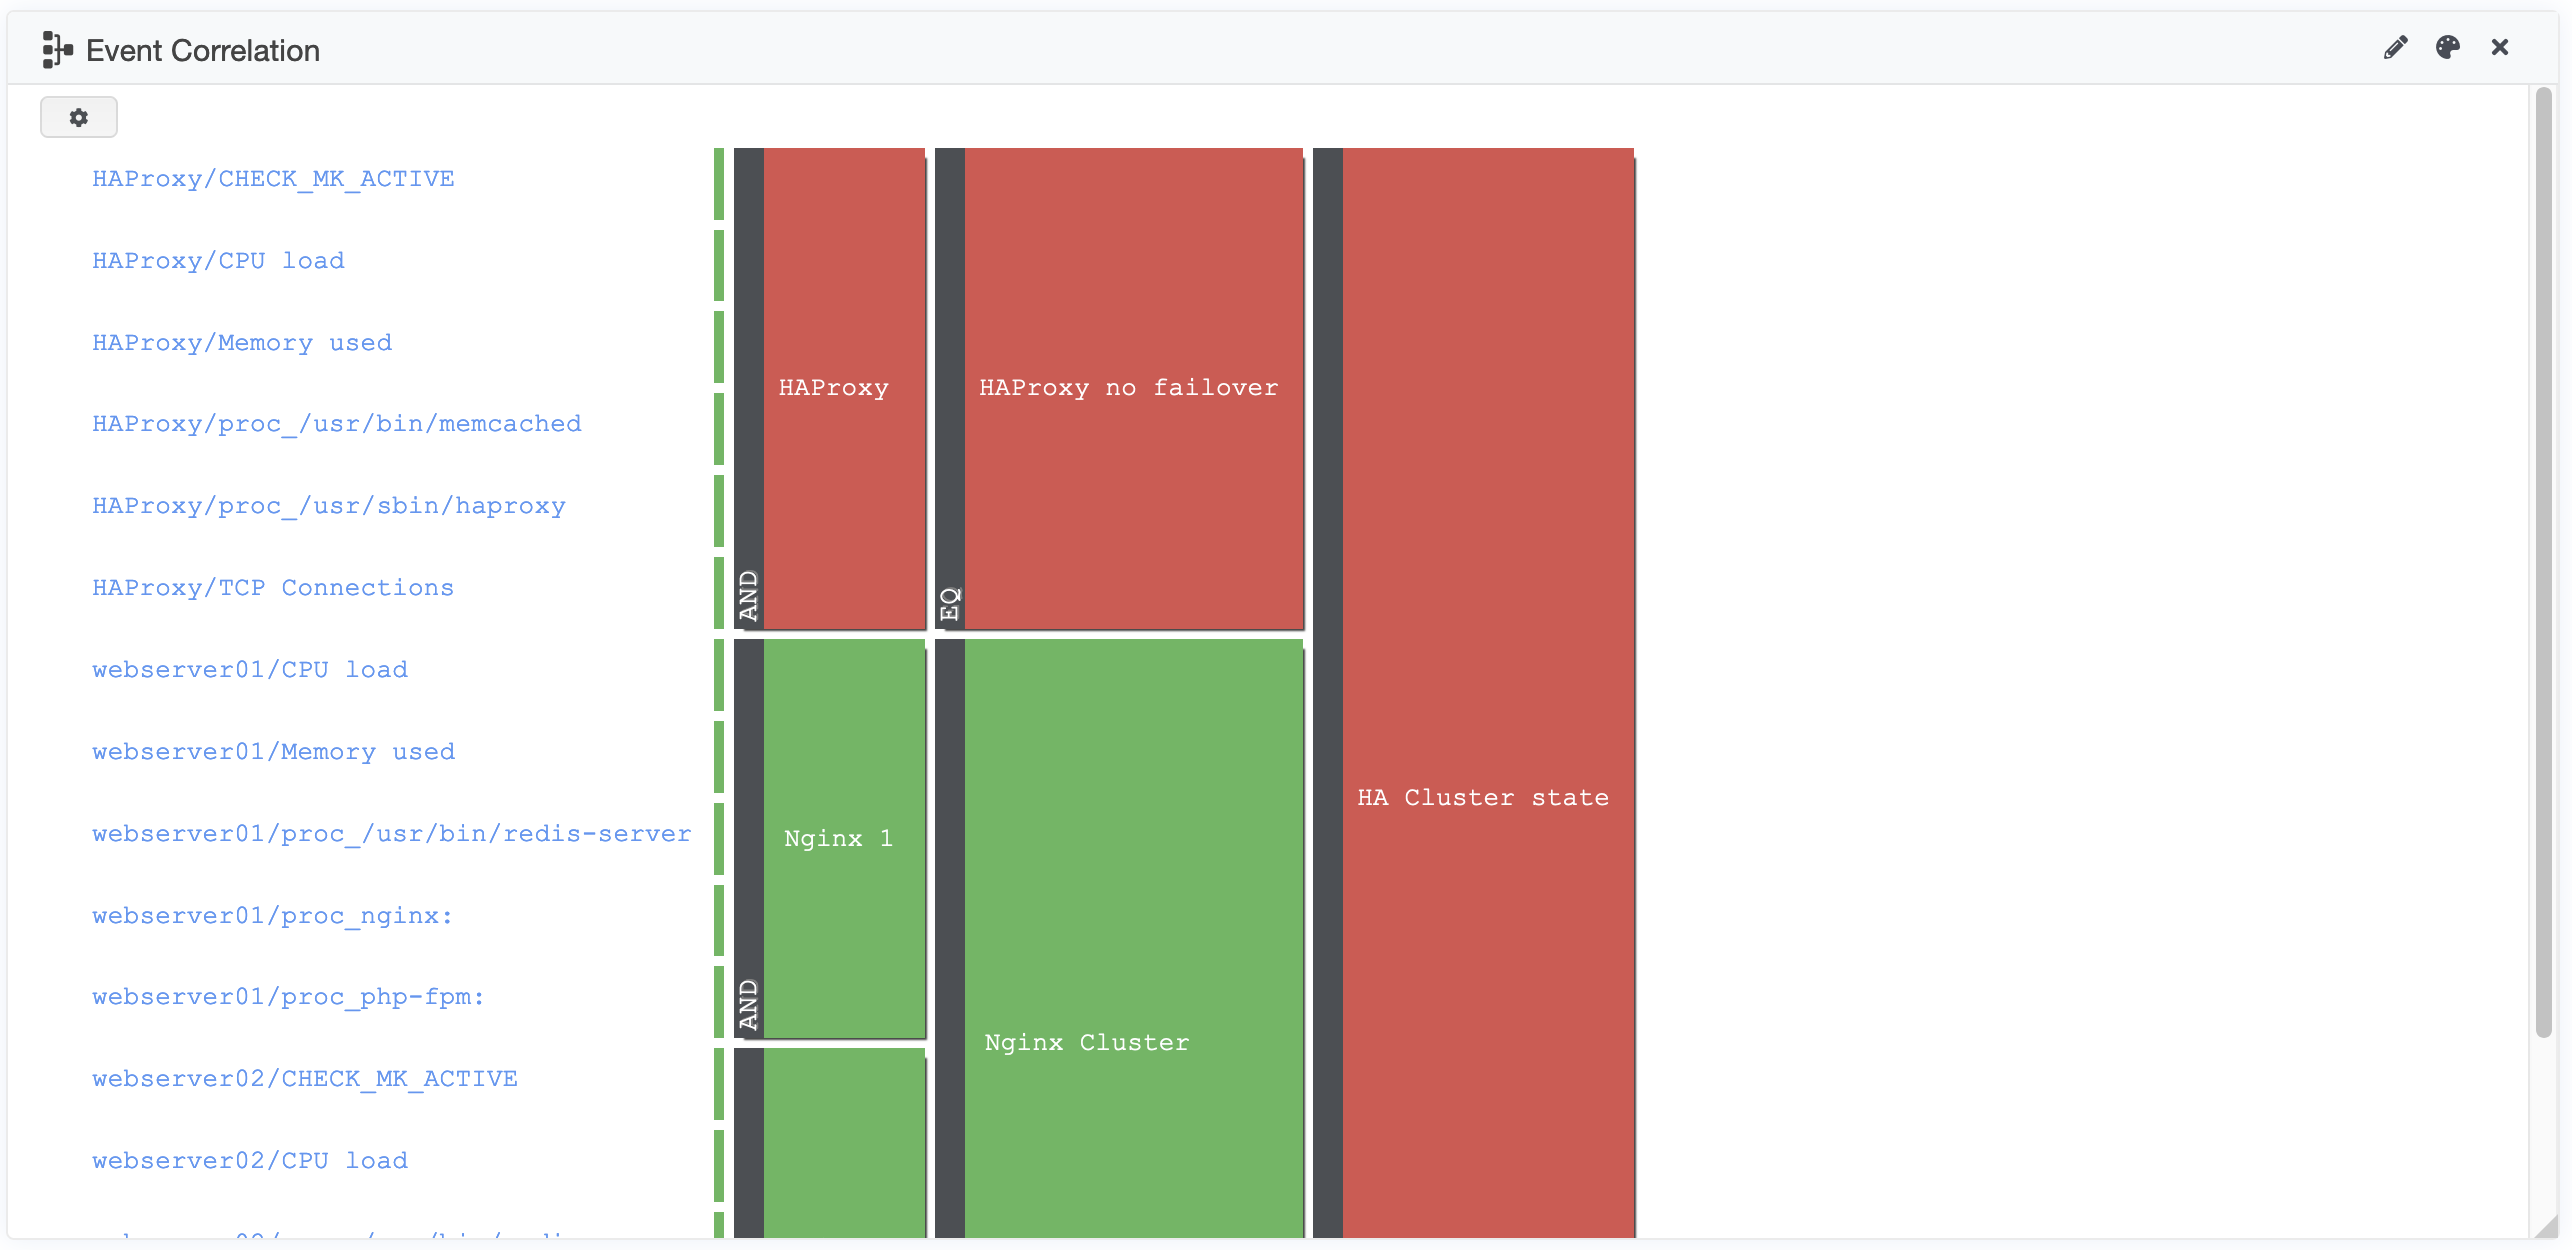
The widget displays a previously created event correlation.
Configuration
An event correlation must be created beforehand via the EventCorrelationModule. The event correlation can then be selected using the widget configuration interface. The widget configuration interface can be accessed via the gear symbol in the upper right area of the widget.
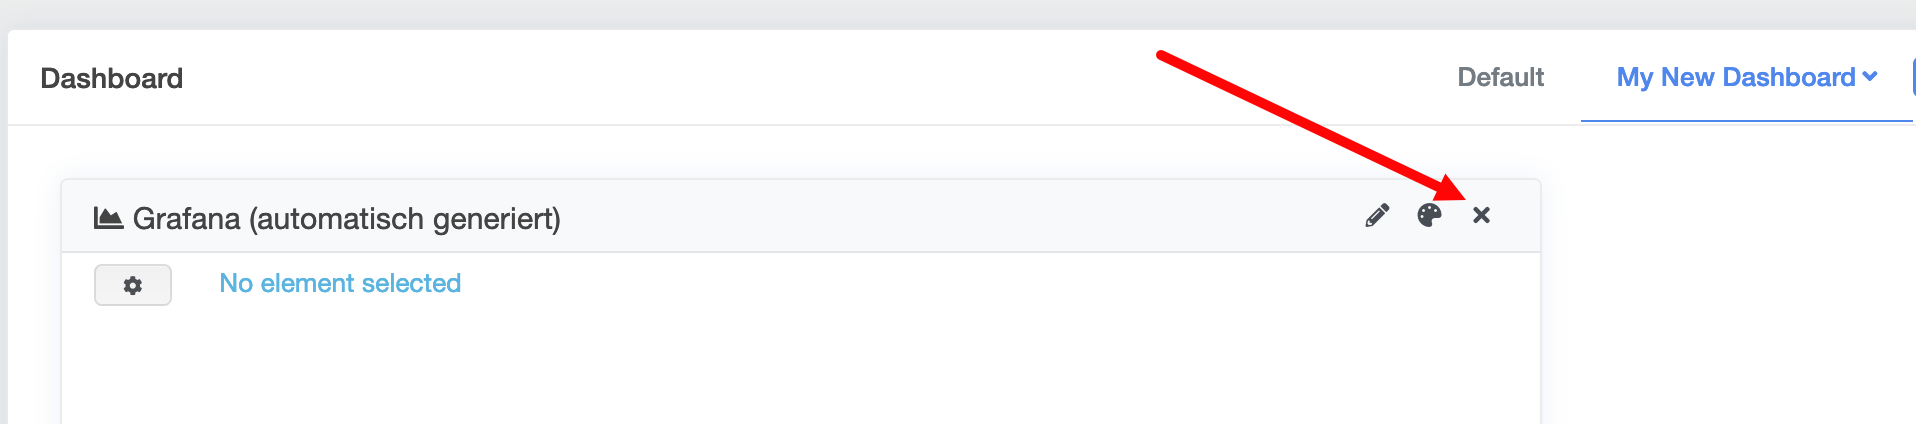
Deleting widgets
To delete a widget, simply click on the x symbol of the corresponding widget.
Restore defaults
To restore the defaults for a dashboard tab, click the Restore Defaults button in the adding dashboard widgets list.
