Prometheus Proxy
Prometheus uses so-called "Exporters" to collect metrics, most of which run on the remote systems you want to monitor. By default, the connection is not encrypted.
Each exporter exposes its own port; for example, the node_exporter exposes port 9100 and the windows_exporter uses port 9182 by default.
Especially when monitoring across different networks or through the internet, you need to add authentication and encryption to your monitoring setup. Most exporters support some sort of security configuration to enable authentication and encryption. However, this means you have to configure every single exporter, and you still have to deal with all the different ports.
The openITCOCKPIT Monitoring Agent can act as a reverse proxy for Prometheus Exporters. The connection will be encrypted by default, using the same certificate as the openITCOCKPIT Agent. This means no manual configuration is required, and only the openITCOCKPIT system can talk to your Prometheus Exporters.
The connection is handled by the openITCOCKPIT Agent (Port 3333 by default), so you don't even have to adjust any firewall rules.
Notice
Currently, the Prometheus Proxy feature is only available in Pull Mode.
How to setup
This section describes, how to set up the openITCOCKPIT Agent as a Proxy for Prometheus Exporters.
Install Prometheus Exporters
Install all Prometheus Exporters as you normally would. This documentation demonstrates the process using the node_exporter and mysqld_exporter.
Danger
For security reasons, make sure that the Prometheus Exporters only listen to localhost (127.0.0.1 or ::1).
For the node_exporter and mysqld_exporter this can be changed with the --web.listen-address=127.0.0.1:9100 option.
It is not necessary for the Prometheus Exporters to be exposed to the network.
Install the openITCOCKPIT Monitoring Agent
If not already done, please install the latest version of the openITCOCKPIT Monitoring Agent. You can find the latest setup on the official download page.
Configure the Agent
It is important to add all Prometheus Exporters you want to expose through the openITCOCKPIT Agent into the configuration file prometheus_exporters.ini. Please see this page for the exact file location on different operating systems.
Add a new section for each exporter.
[node_exporter]
enabled = True
method = http
port = 9100
path = /metrics
interval = 15
timeout = 5

[mysqld_exporter]
enabled = True
method = http
port = 9104
path = /metrics
interval = 15
timeout = 5
[node_exporter]- The name of the Exporter.enabled-TrueorFalse- Determines if the openITCOCKPIT Agent should scrape this Prometheus Exporter.method-httporhttps.port- The port number used by the Prometheus Exporter.path- The path the openITCOCKPIT Agent should scrape.interval- Scrape interval in seconds.timeout- Scrape timeout in seconds.
To apply the configuration, restart the openITCOCKPIT Monitoring Agent.
openITCOCKPIT configuration
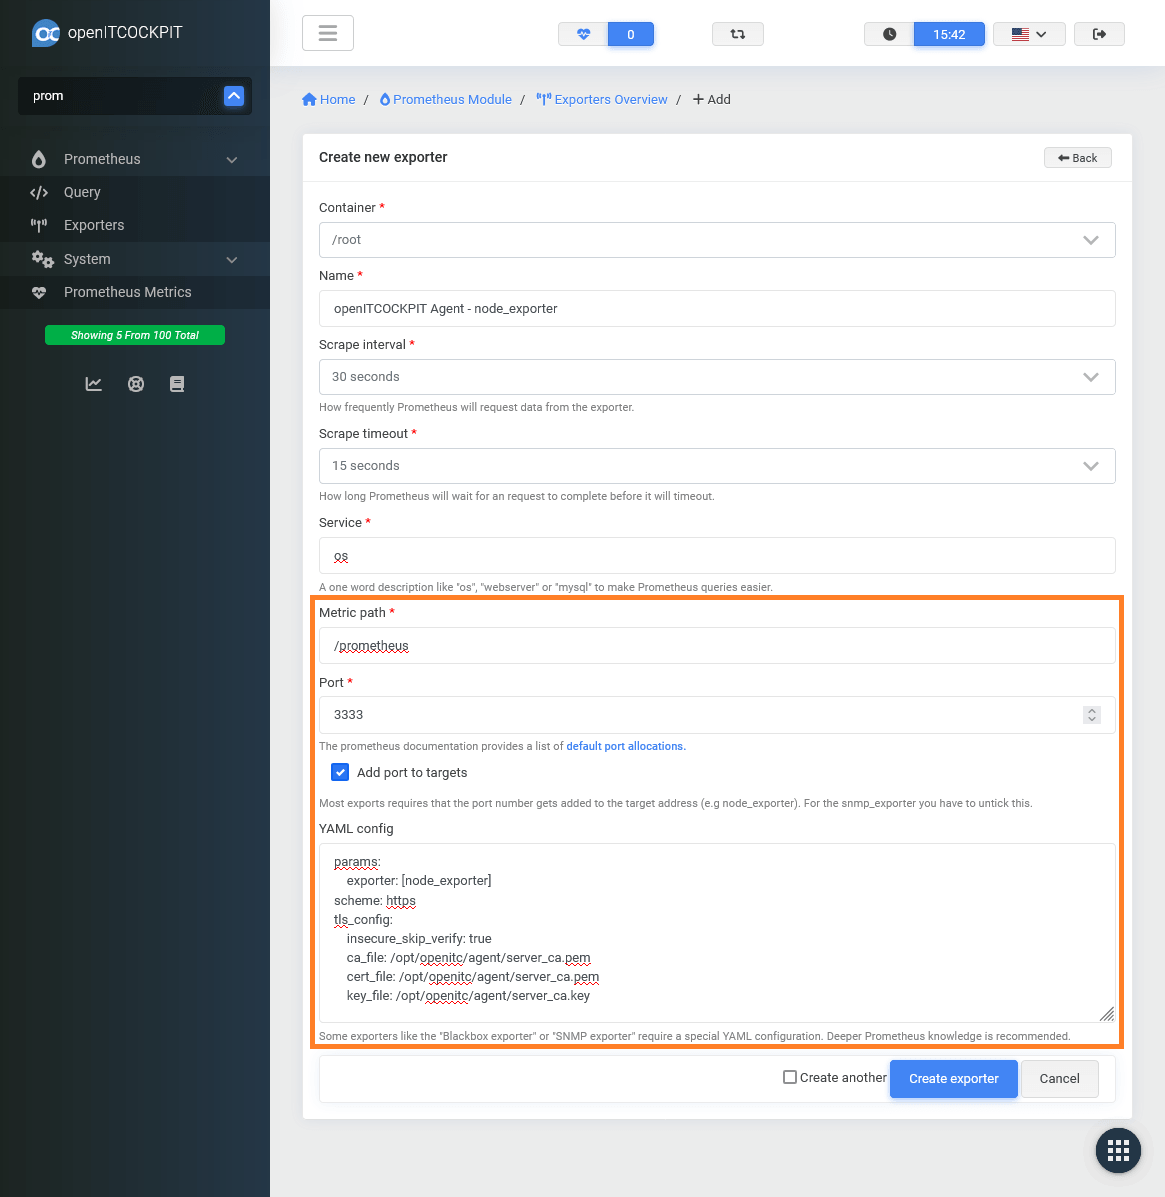
To query the Prometheus Exporters through the openITCOCKPIT Monitoring Agent, you need to create a new Exporter Configuration through the openITCOCKPIT Web Interface. Create a new Exporter Configuration for each exporter. In this case, two:
openITCOCKPIT Agent - node_exporter
- Name:
openITCOCKPIT Agent - node_exporter - Metrics path:
/prometheus - Port:
3333(default port of the openITCOCKPIT Agent) - Add port to targets:
Yes
The parameter exporter: [node_exporter] is important. It tells the openITCOCKPIT Monitoring Agent which Exporter should be targeted. It has to be the same name as you have defined in the Agent's prometheus_exporters.ini.
params:
    exporter: [node_exporter]
scheme: https
tls_config:
    insecure_skip_verify: true
    ca_file: /opt/openitc/agent/server_ca.pem
    cert_file: /opt/openitc/agent/server_ca.pem
    key_file: /opt/openitc/agent/server_ca.key
openITCOCKPIT Agent - mysqld_exporter
- Name:
openITCOCKPIT Agent - mysqld_exporter - Metrics path:
/prometheus - Port:
3333(default port of the openITCOCKPIT Agent) - Add port to targets:
Yes
YAML config:
The parameter exporter: [mysqld_exporter] is important. It tells the openITCOCKPIT Monitoring Agent which Exporter should be targeted. It has to be the same name as you have defined in the Agent's prometheus_exporters.ini.
params:
    exporter: [mysqld_exporter]
scheme: https
tls_config:
    insecure_skip_verify: true
    ca_file: /opt/openitc/agent/server_ca.pem
    cert_file: /opt/openitc/agent/server_ca.pem
    key_file: /opt/openitc/agent/server_ca.key
Before you continue, make sure to refresh your monitoring configuration.

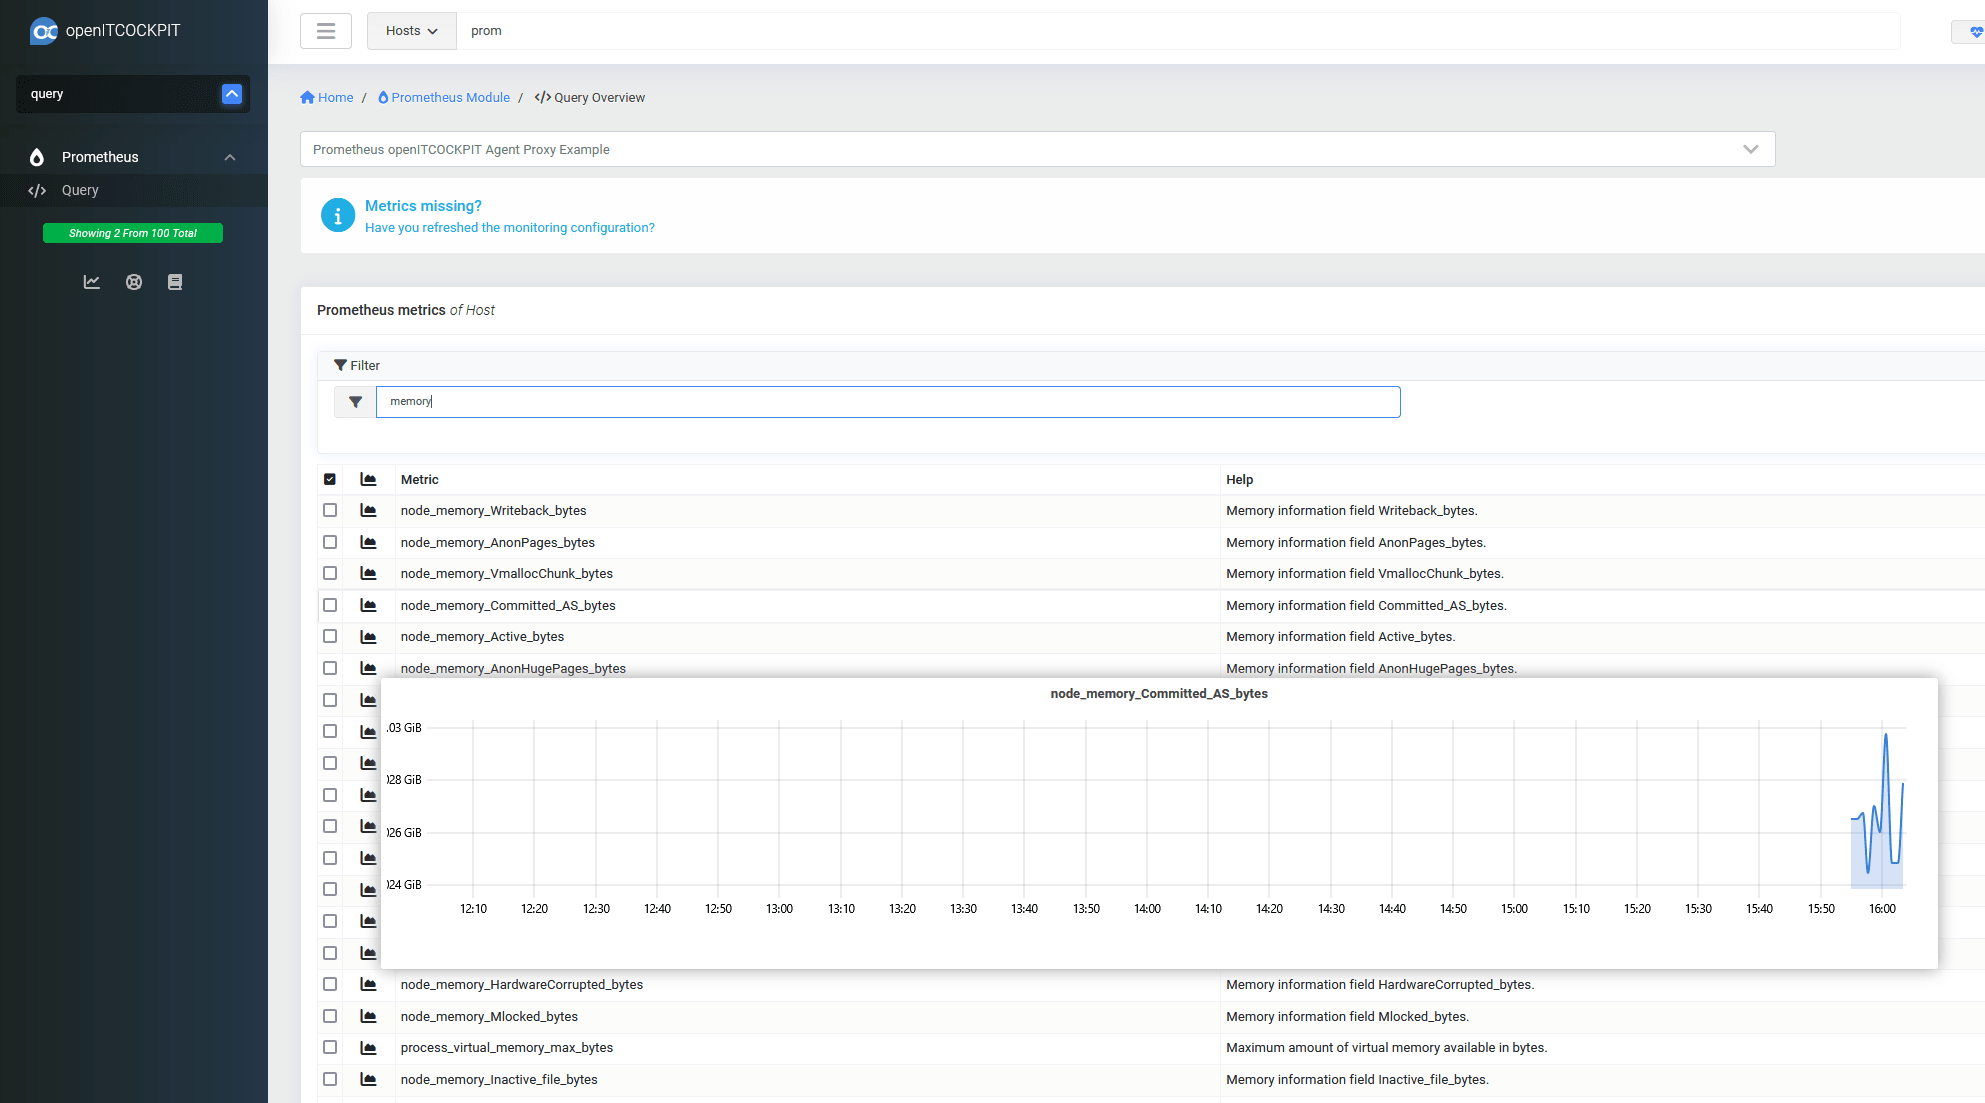
Thats it! Now you are ready to start monitoring. For more information about how to use Prometheus with openITCOCKPIT, please see this documentation.
Troubleshooting
The /prometheus API endpoint of the Agent will return all handled Prometheus Exporters. In case some metrics are missing, make sure that the expoter is enabled and also known to the Agent by querien the API endpoint.
$ curl -s -k https://<ip-address>:3333/prometheus --cacert /opt/openitc/agent/server_ca.pem --key /opt/openitc/agent/server_ca.key --cert /opt/openitc/agent/server_ca.pem | jq .
[
  "node_exporter",
  "mysqld_exporter"
]
You can also query a specific expoter by passing the exporter parameter: /prometheus?exporter=node_exporter
$ curl -s -k https://<ip-address>:3333/prometheus?exporter=node_exporter --cacert /opt/openitc/agent/server_ca.pem --key /opt/openitc/agent/server_ca.key --cert /opt/openitc/agent/server_ca.pem
# HELP go_gc_duration_seconds A summary of the pause duration of garbage collection cycles.
# TYPE go_gc_duration_seconds summary
go_gc_duration_seconds{quantile="0"} 2.572e-05
go_gc_duration_seconds{quantile="0.25"} 3.904e-05
go_gc_duration_seconds{quantile="0.5"} 5.144e-05
go_gc_duration_seconds{quantile="0.75"} 5.7401e-05
go_gc_duration_seconds{quantile="1"} 0.00134869
go_gc_duration_seconds_sum 0.001892574
go_gc_duration_seconds_count 12
# HELP go_goroutines Number of goroutines that currently exist.
In case you pass a unknown exporter the Agent will respond with Unknown exporter
curl -s -k https://<ip-address>:3333/prometheus?exporter=foobar_exporter --cacert /opt/openitc/agent/server_ca.pem --key /opt/openitc/agent/server_ca.key --cert /opt/openitc/agent/server_ca.pem
Unknown exporter


